Release Notes
Getting started
DE-CIX Access
Overview and technical specifications
Create a new Access or LAG
Monitor your Access
Delete your Access
GlobePEER
Overview GlobePEER
Create your GlobePEER service
Manage your GlobePEER service
Delete your GlobePEER service
Blackholing Services
Route Service
Route Server Guides
DE-CIX ASEAN GlobePEER Route Server Guide
DE-CIX Barcelona GlobePEER Route Server Guide
DE-CIX Chicago GlobePEER Route Server Guide
DE-CIX Copenhagen GlobePEER Route Server Guide
DE-CIX Dallas GlobePEER Route Server Guide
DE-CIX Dusseldorf GlobePEER Route Server Guide
DE-CIX Esbjerg GlobePEER Route Server Guide
DE-CIX Frankfurt GlobePEER Route Server Guide
DE-CIX Hamburg GlobePEER Route Server Guide
DE-CIX Helsinki GlobePEER Route Server Guide
DE-CIX Houston GlobePEER Route Server Guide
DE-CIX Istanbul GlobePEER Route Server Guide
DE-CIX Jakarta GlobePEER Route Server Guide
DE-CIX Kristiansand GlobePEER Route Server Guide
DE-CIX Kuala Lumpur GlobePEER Route Server Guide
DE-CIX Leipzig GlobePEER Route Server Guide
DE-CIX Lisbon GlobePEER Route Server Guide
DE-CIX Madrid GlobePEER Route Server Guide
DE-CIX Malaysia GlobePEER Route Server Guide
DE-CIX Marseille GlobePEER Route Server Guide
DE-CIX Mexico GlobePEER Route Server Guide
DE-CIX Munich GlobePEER Route Server Guide
DE-CIX New York GlobePEER Route Server Guide
DE-CIX Oslo GlobePEER Route Server Guide
DE-CIX Palermo GlobePEER Route Server Guide
DE-CIX Phoenix GlobePEER Route Server Guide
DE-CIX Richmond GlobePEER Route Server Guide
DE-CIX Rio De Janeiro GlobePEER Route Server Guide
DE-CIX Sao Paulo GlobePEER Route Server Guide
ACIX GlobePEER Route Server Guide
AF-CIX GlobePEER Route Server Guide
AqabaIX GlobePEER Route Server Guide
Borneo-IX GlobePEER Route Server Guide
Doha IX Route Server Guide
IRAQ-IXP Route Server Guide
Penang IX Route Server Guide
PIE Karachi GlobePEER Route Server Guide
Ruhr-CIX GlobePEER Route Server Guide
SEECIX GlobePEER Route Server Guide
UAE-IX GlobePEER Route Server Guide
Action BGP Communities (Route Server Control)
DE-CIX GlobePEER Route Server Action BGP Communities
ACIX GlobePEER Route Server Action BGP Communities
AF-CIX GlobePEER Route Server Action BGP Communities
AqabaIX GlobePEER Route Server Action BGP Communities
Borneo-IX GlobePEER Route Server Action BGP Communities
IRAQ-IXP Route Server Action BGP Communities
PIE Karachi GlobePEER Route Server Action BGP Communities
Ruhr-CIX GlobePEER Route Server Action BGP Communities
SEECIX GlobePEER Route Server Action BGP Communities
UAE-IX GlobePEER Route Server Action BGP Communities
Doha IX Route Server Action BGP Communities
Informational BGP Communities (Route Details)
DE-CIX GlobePEER Route Server Informational BGP Communities
ACIX GlobePEER Route Server Informational BGP Communities
AF-CIX GlobePEER Route Server Informational BGP Communities
AqabaIX GlobePEEER Route Server Informational BGP Communities
Borneo-IX GlobePEER Route Server Informational BGP Communities
IRAQ-IXP Route Server Informational BGP Communities
PIE Karachi GlobePEER Route Server Informational BGP Communities
Ruhr-CIX GlobePEER Route Server Informational BGP Communities
SEECIX GlobePEER Route Server Informational BGP Communities
UAE-IX GlobePEER Route Server Informational BGP Communities
Doha IX Route Server Informational BGP Communities
Looking Glass Guides
DE-CIX GlobePEER Looking Glass Guide
ACIX GlobePEER Looking Glass Guide
AF-CIX GlobePEER Looking Glass Guide
AqabaIX GlobePEER Looking Glass Guide
Borneo-IX GlobePEER Looking Glass Guide
IRAQ-IXP Looking Glass Guide
PIE Karachi Looking Glass Guide
Ruhr-CIX GlobePEER Looking Glass Guide
SEECIX GlobePEER Looking Glass Guide
UAE-IX GlobePEER Looking Glass Guide
Doha IX Looking Glass Guide
Notes on additional Routes (incl. Google VPP) via GlobePEER Route Service
Closed User Groups
DirectCLOUD
Overview and Monitoring
Cloud Connections
DirectCLOUD for Microsoft Azure
Create DirectCLOUD Connection for Azure
How to order a DirectCLOUD connection for Azure
Create or upgrade Gateways for your Azure ExpressRoute
Manage your Azure Cloud Connection
Upgrade / downgrade a DirectCLOUD service for Azure
Change DirectCLOUD configurations for Azure
Delete DirectCLOUD configurations for Azure
Monitoring Azure ExpressRoute uptime
Monitor your connection
Updating the Cloud Key for Your Azure DirectCLOUD Service
Delete your Azure Cloud connection
FAQ DirectCLOUD for Microsoft Azure
DirectCLOUD for AWS
Create DirectCLOUD connection for AWS
Manage your DirectCLOUD connection for AWS
Upgrade / downgrade the connection
Change DirectCLOUD configurations for AWS
Delete DirectCLOUD configurations for AWS
Monitoring AWS DirectConnect uptime
Monitor your connection
Delete your AWS Cloud connection
DirectCLOUD for IBM
Create DirectCLOUD connection for IBM
Manage your DirectCLOUD connection for IBM
Upgrade / downgrade a DirectCLOUD service for IBM
Change DirectCLOUD configurations for IBM
Delete DirectCLOUD configurations for IBM
Monitor your connection
Delete your IBM Cloud connection
DirectCLOUD for GCloud
Create DirectCLOUD connection for GCloud
Manage your DirectCLOUD connection for GCloud
Upgrade / downgrade the connection
Change DirectCLOUD configurations for GCloud
Delete DirectCLOUD configurations for GCloud
Monitor your connection
Delete your GCloud connection
DirectCLOUD for Oracle
Cloud ROUTER
Overview & use cases
Create / Manage your Cloud ROUTER
Create / Manage the configurations
Add a configuration
Upgrade / downgrade a configuration
Change your Cloud ROUTER configurations
Monitor your configurations
Delete a Cloud ROUTER configuration
Advanced Settings Cloud ROUTER
VirtualPNI
Overview VirtualPNI
Create your VirtualPNI
Order and configure your VirtualPNI between two Accesses
Order and configure your VirtualPNI between Access and Cloud ROUTER
Manage your VirtualPNI
Upgrade / Downgrade your VirtualPNI service
Change VirtualPNI configurations
Delete VirtualPNI configurations
Monitor your VirtualPNI
Delete your VirtualPNI service
Colocation
Out-of-band access to your DE-CIX colocated equipment
Shipping Information
Colocation equipment management for Digital Realty data centers
DE-CIX API
Overview DE-CIX API
Quick API Reference
Cloud ROUTER Postman Collection
Monitor and Visibility of Learned Routes and Advertised Routes by API
BGP Ingress and Egress Filters Usage by API
Terraform Provider
Terraform Provider Overview
Getting Started
Provider Configuration
Managing Services
State Management
End-to-End Example
Service Insights System
Service Insights System - Tutorial
Standard customer Service Insights Tutorial (for customers without reselling services or DaaS location)
Service Telemetry Insights Tutorial
GlobePEER Traffic Insights Tutorial
GlobePEER Threat Insights Tutorial
Cloud ROUTER Traffic Insights Tutorial
Reseller Service Insights Tutorial
Reseller GlobePEER Traffic Insights Tutorial
Reseller GlobePEER Threat Insights Tutorial
Reseller Service Telemetry Insights Tutorial
Partner (DaaS) Service Insights Tutorial
Partner GlobePEER Traffic Insights Tutorial
Partner Service Telemetry Insights Tutorial
Partner GlobePEER Threat Insights Tutorial
Service Insights Tutorial - General Informations
Service Insights System
Account administration
Add new users or subcustomers
Manage user roles and permissions
Multi-Factor-Authentification
Retrieving username and reset password
Delete a user
Customer service and ticket system
Table of Contents
GlobePEER Threat Insights Tutorial

This article shows how to use the Service Insights system to monitor traffic, detect issues, and answer key network questions for our Standard customers, defined as those who neither resell services nor operate a DE-CIX as a service (DaaS) location.
General hints about the usage of Service Insights can be found at: Service Insights Tutorial - General Informations
Am I suffering a DDoS attack?
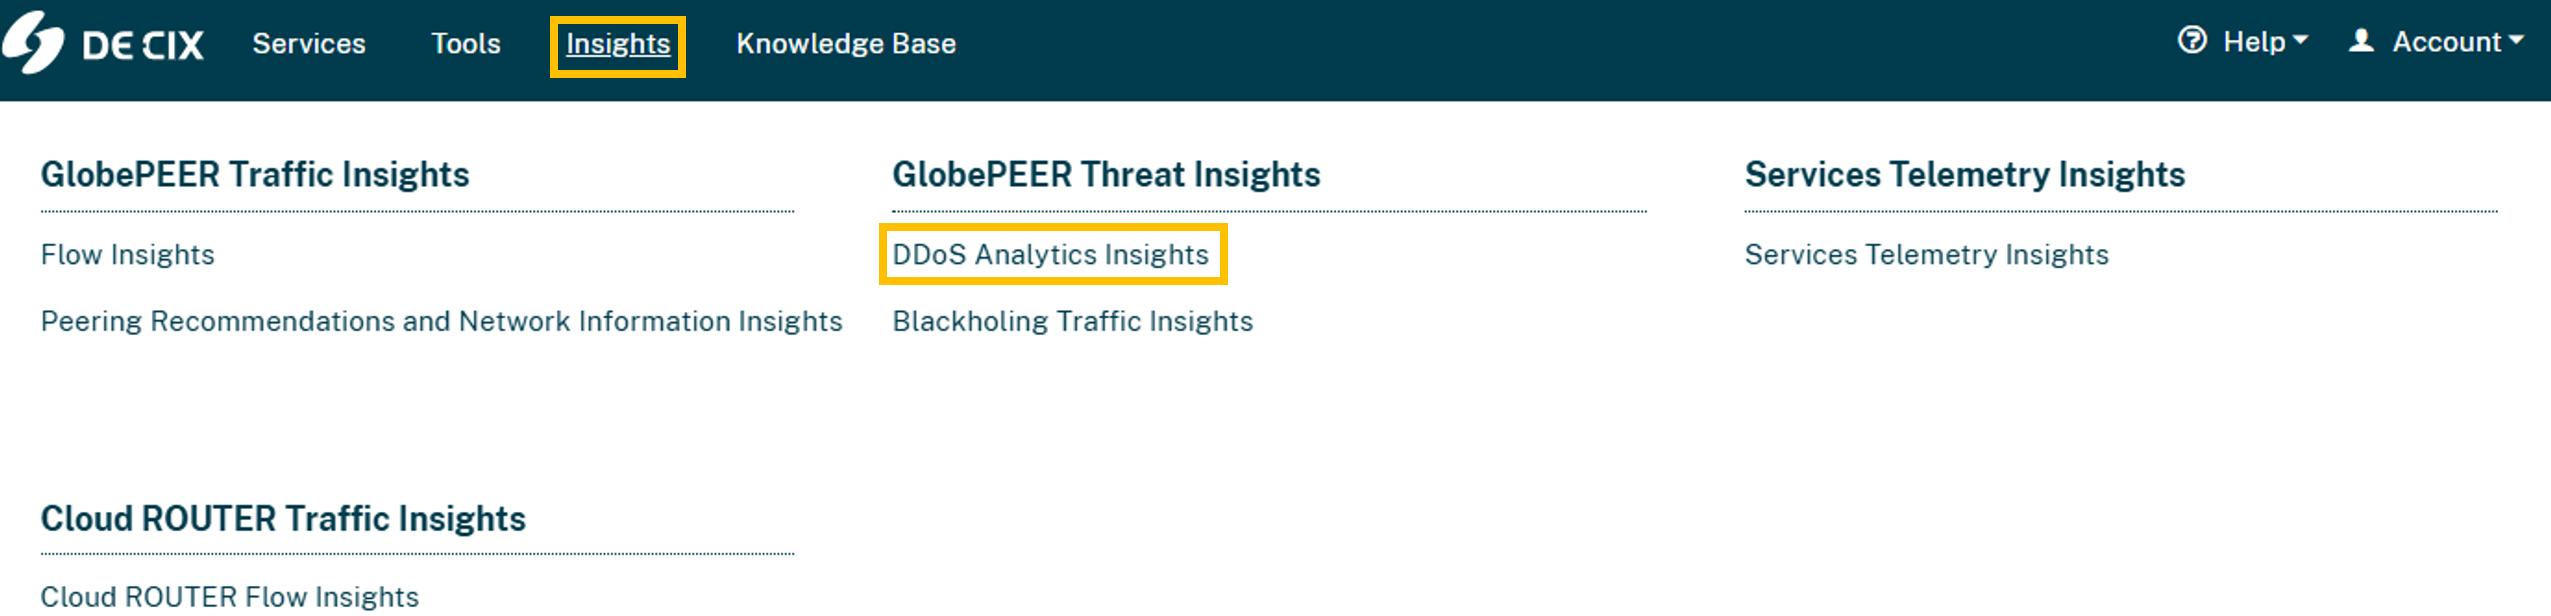
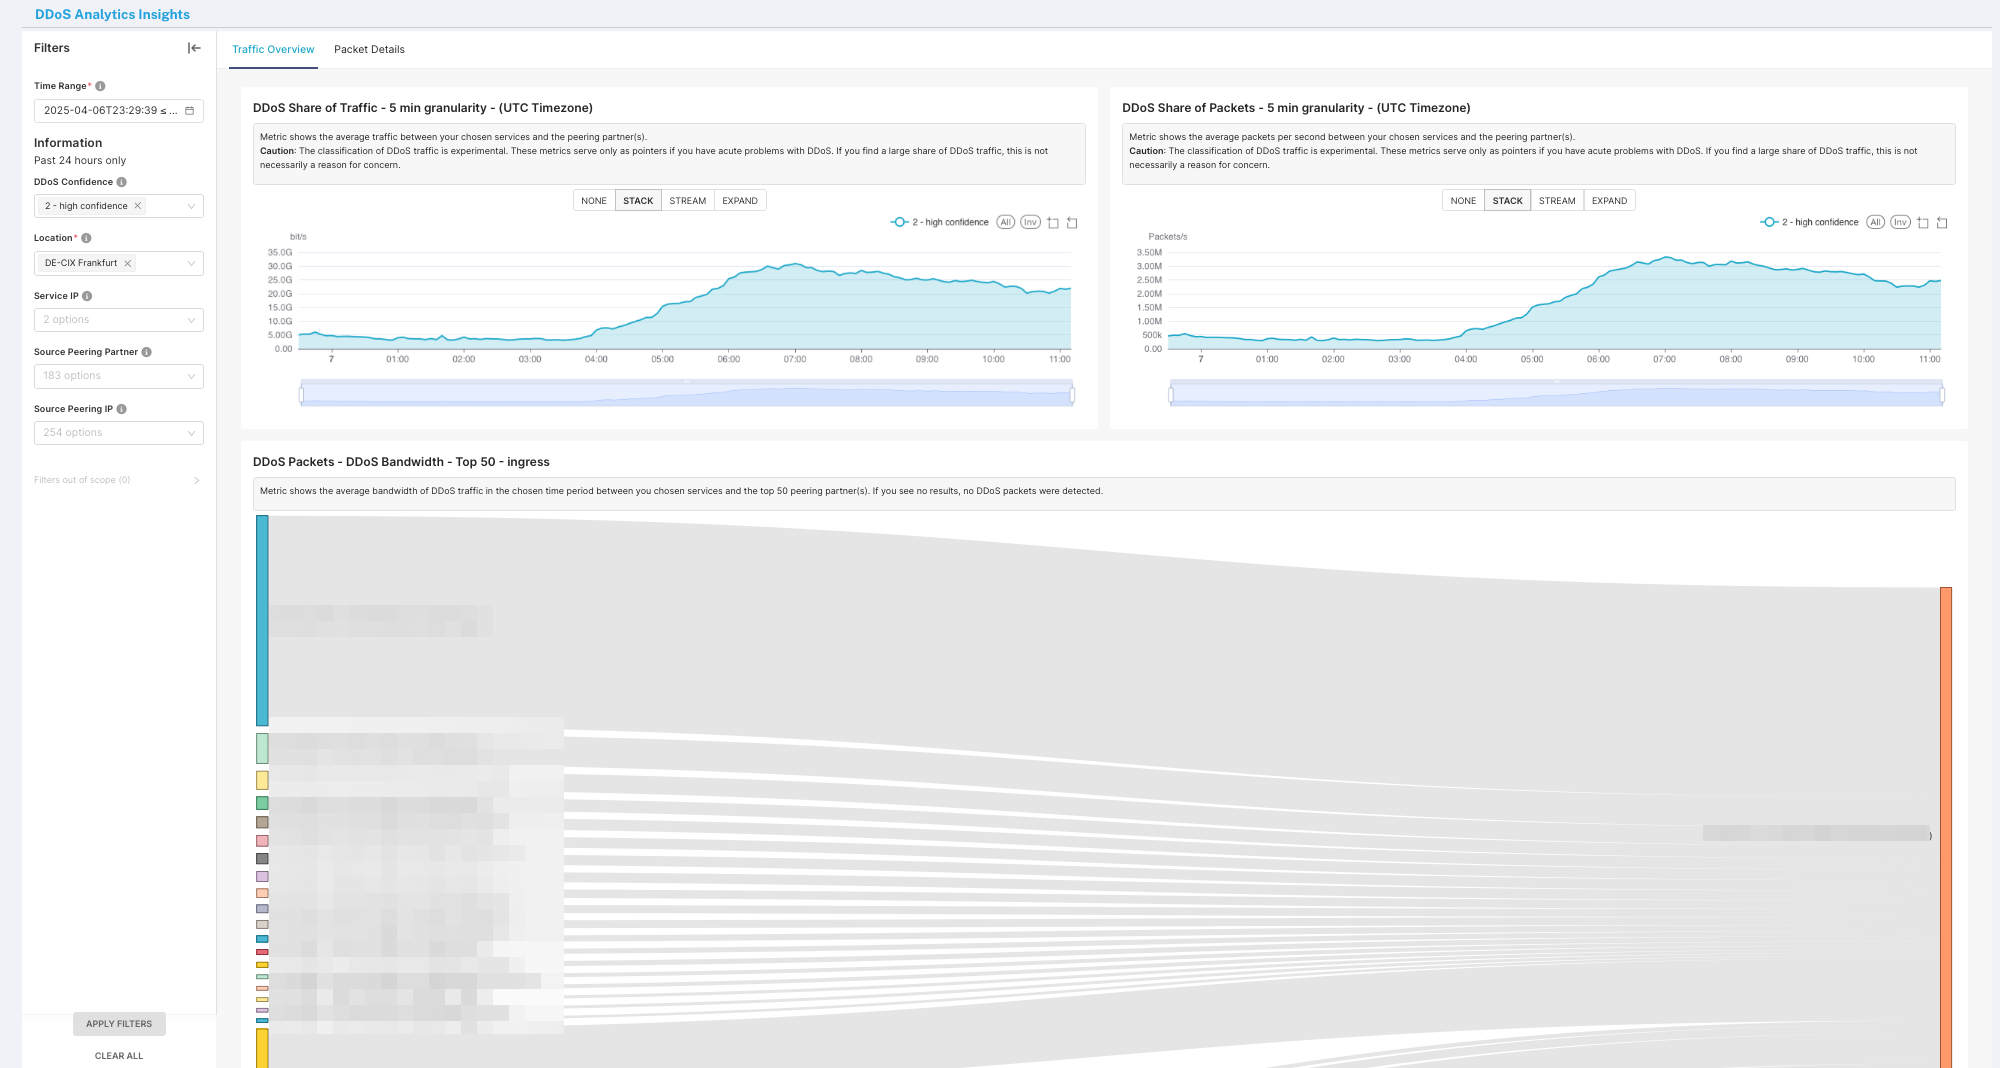
For evaluating DDoS attacks in your traffic, navigate to the GlobePeer DDoS Traffic Insights and enter the section DDoS Analytics Insights.
The dashboard shows you the possible DDoS traffic share of your flow traffic and in the flow (sankey) graph you can see which are your top-talkers.
You can choose the filters in filter section for more specific details.
Choose the service IP you want to see in combination of a high confidence in DDoS Confidence filter. If you will see some high traffic loads then our system is detecting a possible DDoS attack against this/these service IP(s).
When I blackhole traffic for one more more prefixes, how can I see metrics of that traffic?
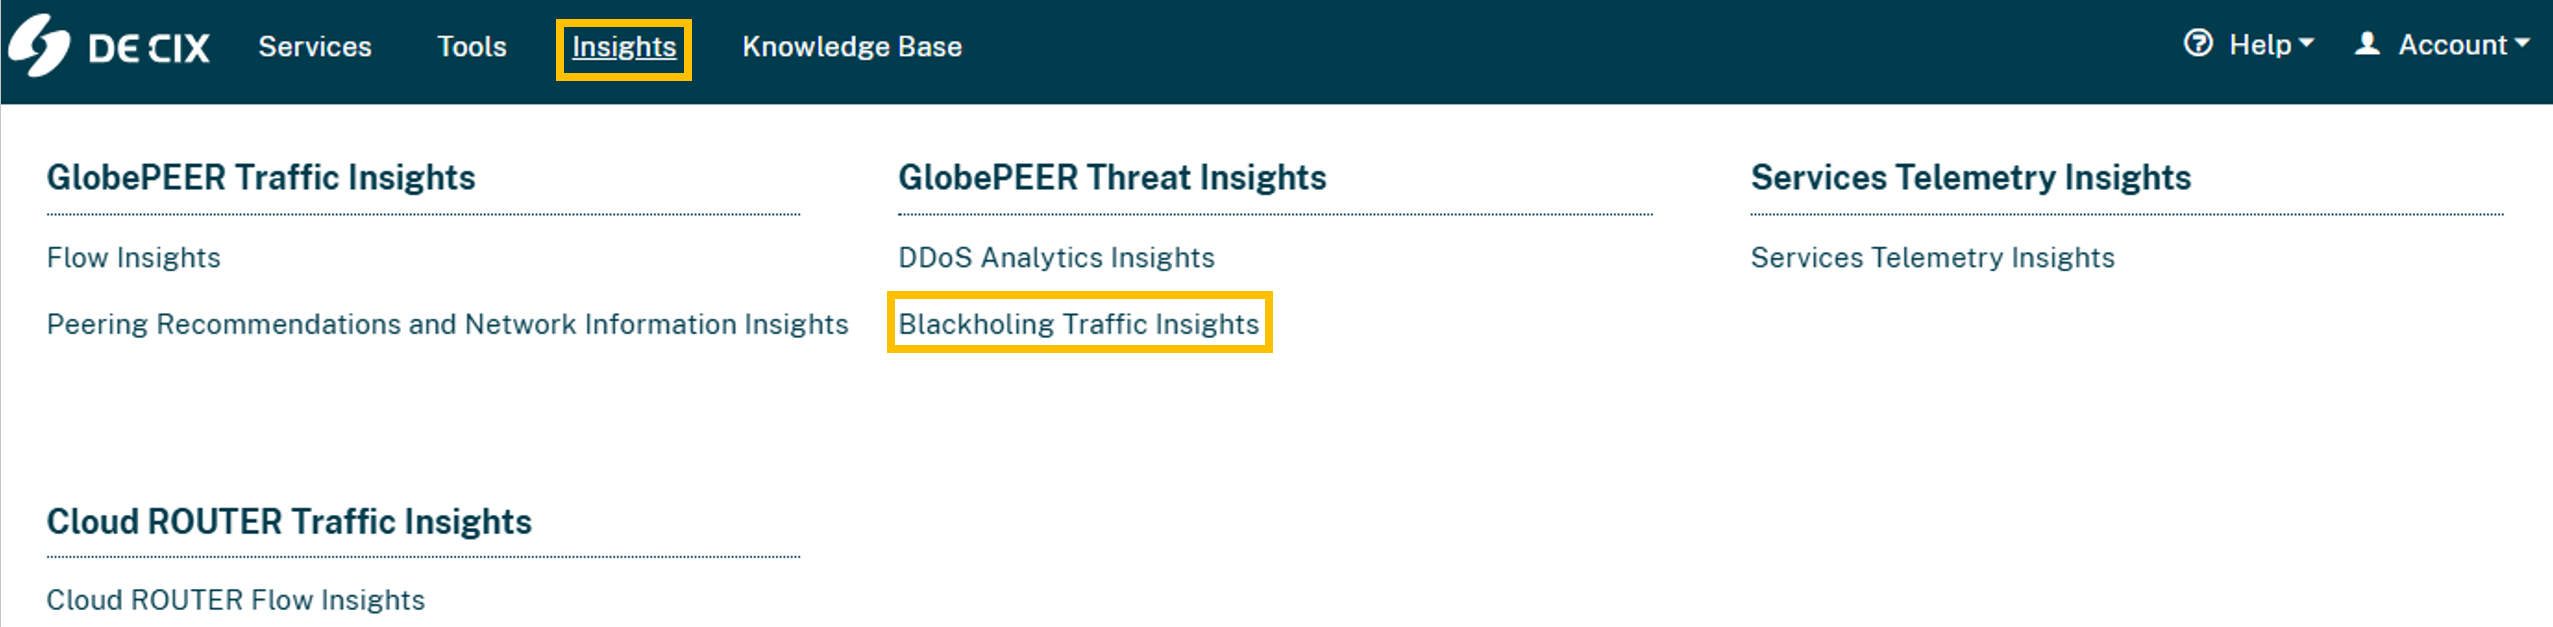
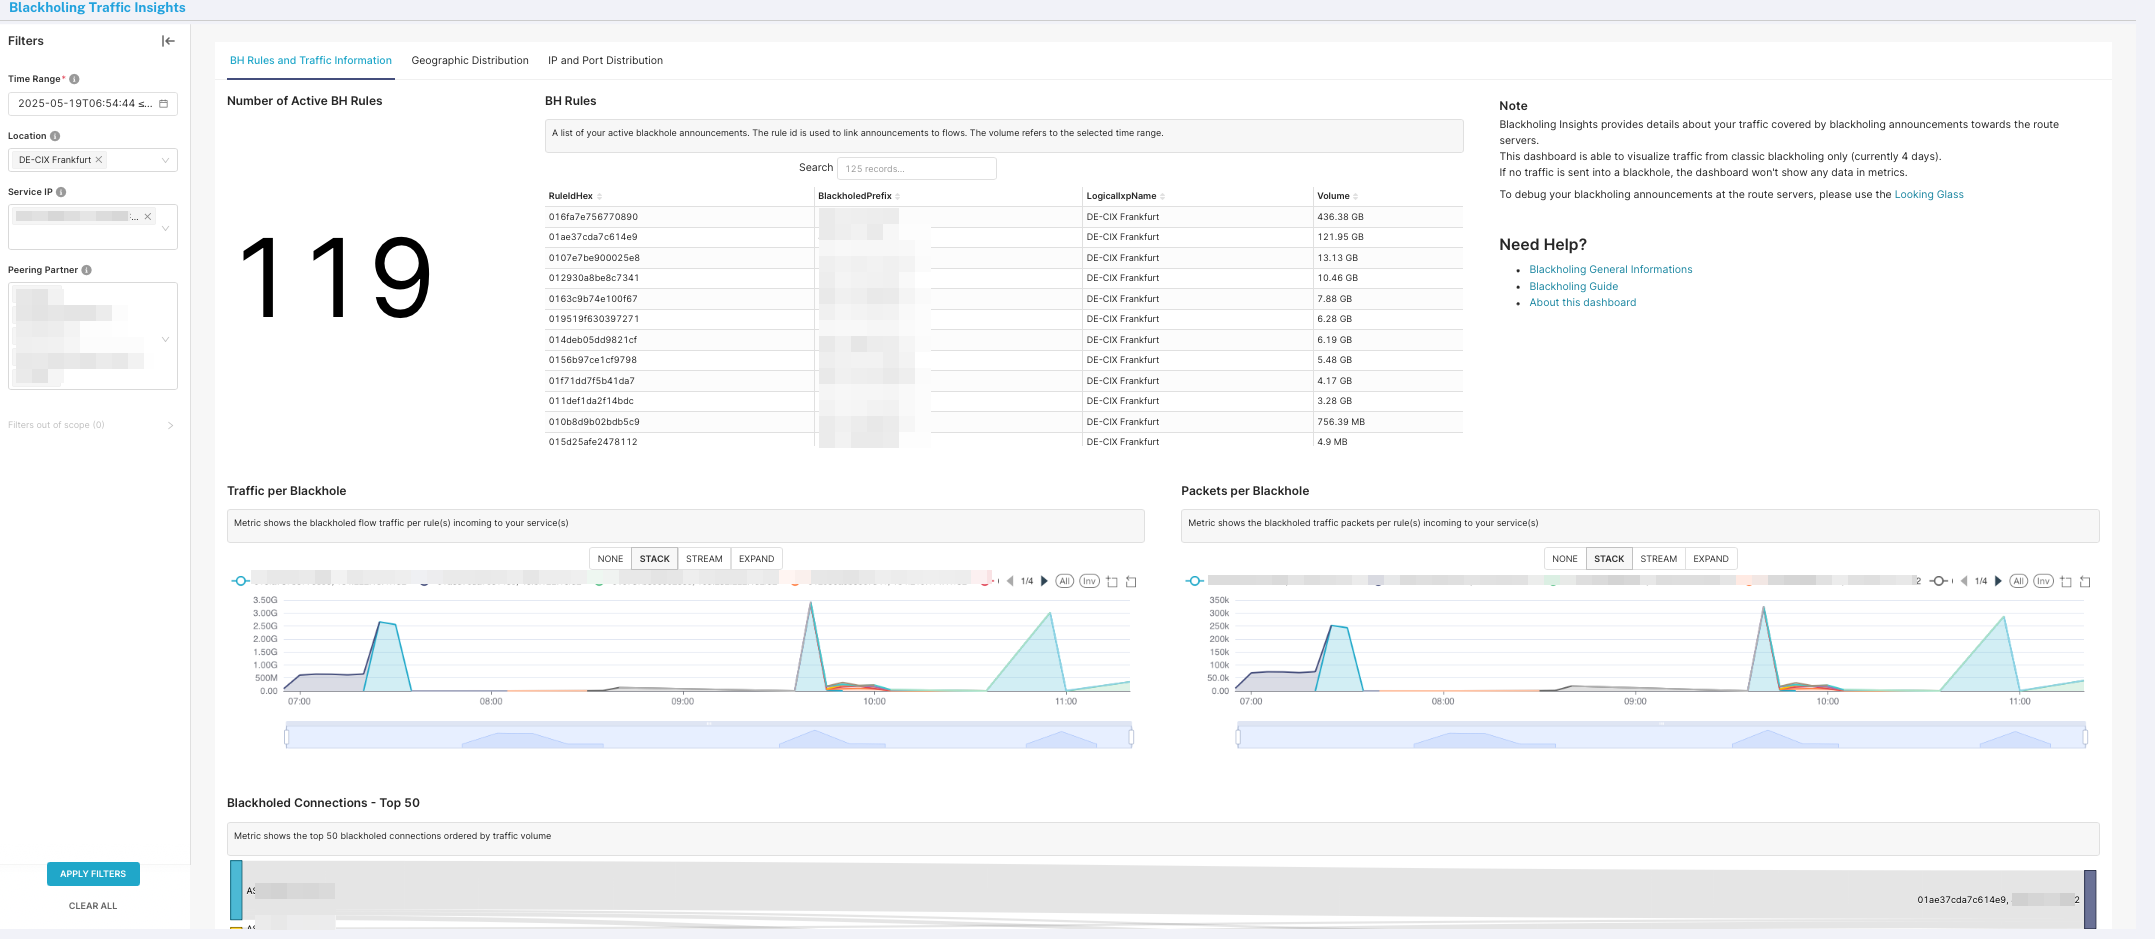
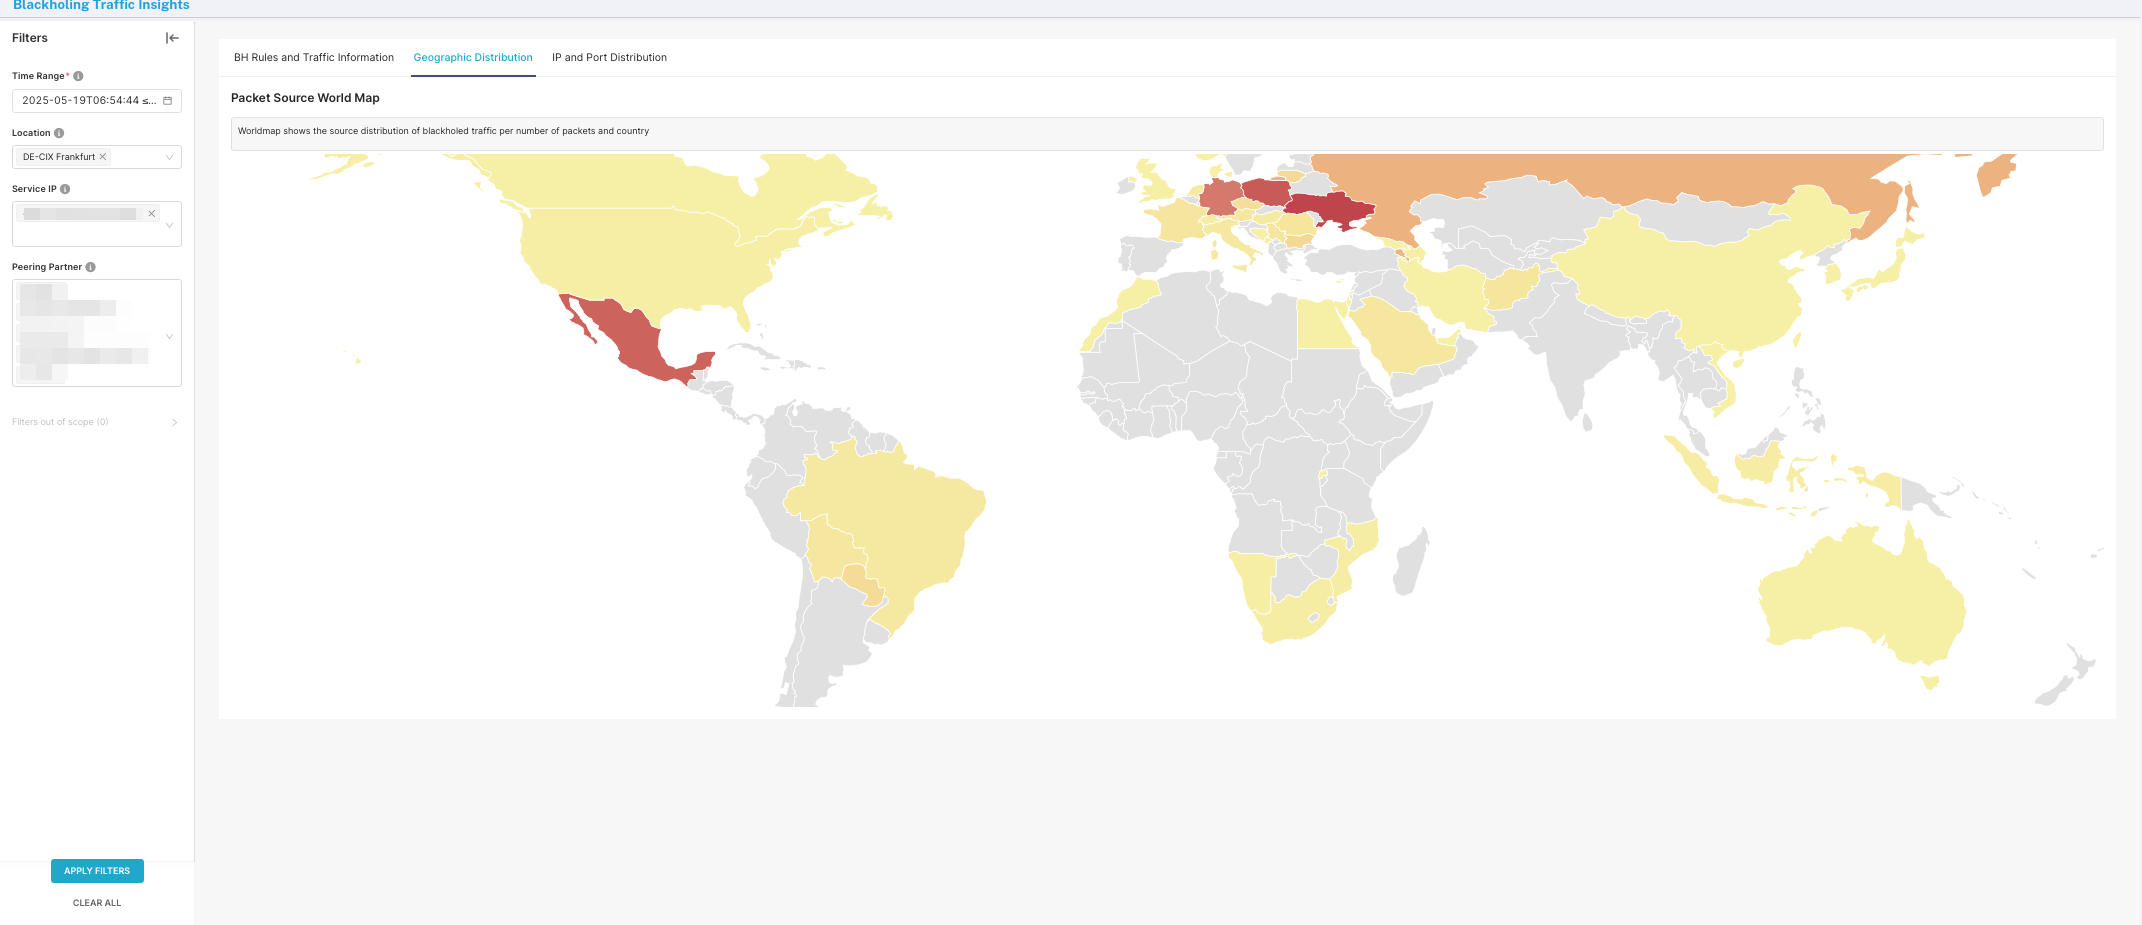
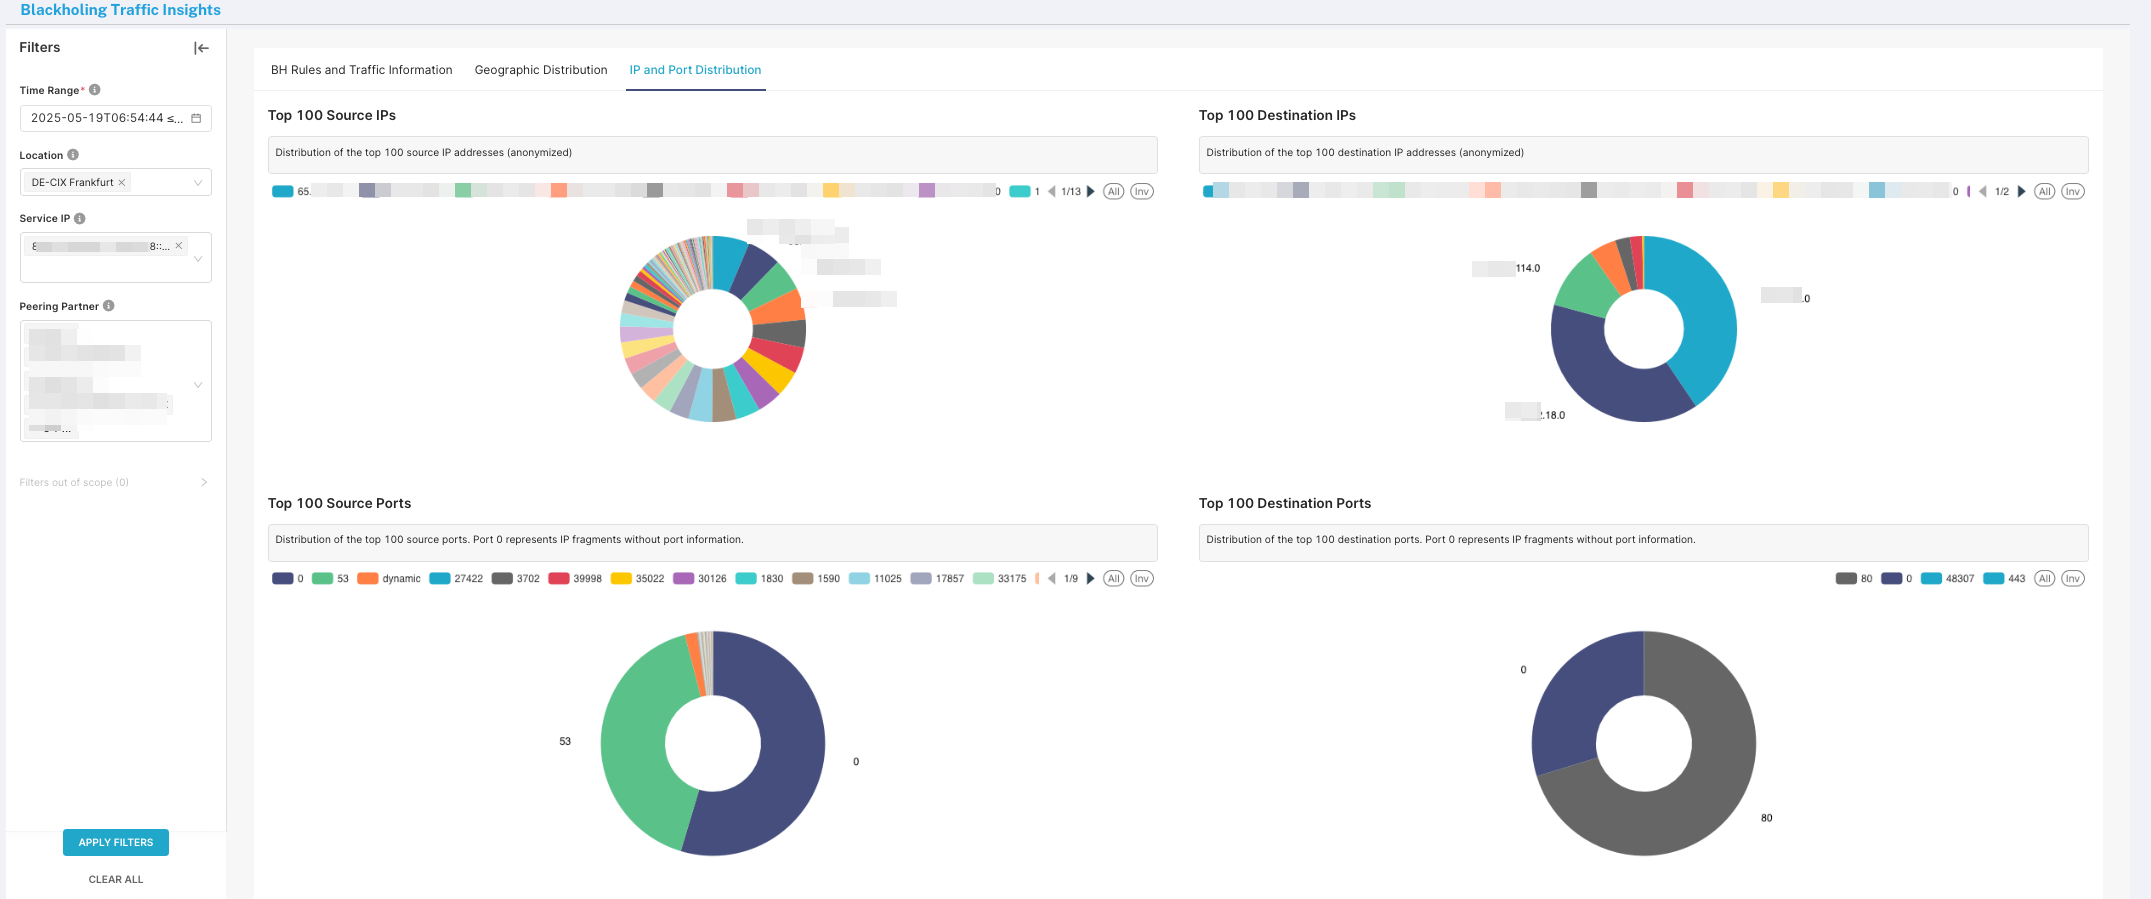
For evaluating Blackholing traffic, navigate to the GlobePeer Threat Insights and enter the section Blackhole Traffic Insights.
The dashboard shows you insights about blackholing traffic like:
- Number of blackholed rules and which rules are matching (BH Rules and Traffic Information dashboard)
- Traffic and packets per rule (BH Rules and Traffic Information dashboard)
- Blackholed connections traffic volume Top 50 (BH Rules and Traffic Information dashboard)
- Geographic distribution per packet source (Geographic Distribution dashboard)
- IP/port distribution pie charts(IP and Port Distribution dashboard)
Need help? Get in touch with our customer service.