Table of Contents
- What are ingress and egress on dashboards?
- Metric Toolbar and cross-filtering options
- Dashboard content description
- GlobePEER Insights
- GlobePEER Insights Filters
- Peering Recommendations and Network Insights
- Peering Recommendations and Network Insights filters
- GlobePEER Threat Insights
- DDoS Analytics Insights
- DDoS Analytics Insights filters
- Blackholing Traffic Insights
- Blackholing Insights filter
- Cloud ROUTER Flow Insights
- Cloud ROUTER Flow Insights Filters
- DE-CIX Services Telemetry Insights
- Access Insights Filters
- Service Insights
Service Insights System

- What are ingress and egress on dashboards?
- Metric Toolbar and cross-filtering options
- Dashboard content description
- GlobePEER Insights
- GlobePEER Insights Filters
- Peering Recommendations and Network Insights
- Peering Recommendations and Network Insights filters
- GlobePEER Threat Insights
- DDoS Analytics Insights
- DDoS Analytics Insights filters
- Blackholing Traffic Insights
- Blackholing Insights filter
- Cloud ROUTER Flow Insights
- Cloud ROUTER Flow Insights Filters
- DE-CIX Services Telemetry Insights
- Access Insights Filters
- Service Insights
This article provides a guide for the new Service Insights System, with which you can analyze your traffic and view Access services statistics.
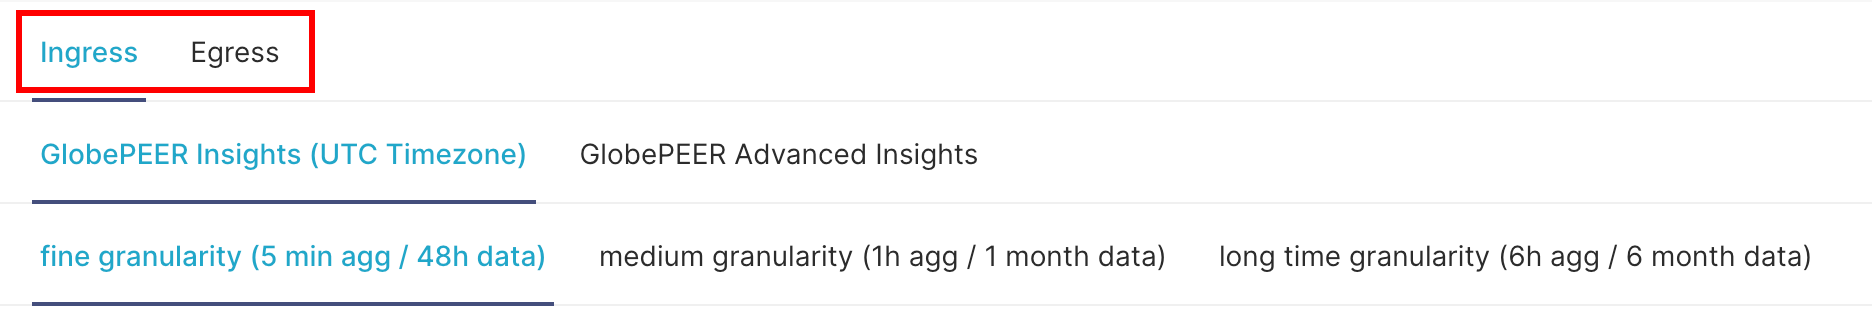
What are ingress and egress on dashboards?
The dashboards provide information about ingress and egress data. It always provides those data from a customer's point of view. For example, in the case of the flow metrics, the dashboard Flow metrics - ingress - 5 min granularity shows the data you are receiving, and the dashboard Flow metrics - egress - 5 min granularity shows the data you sent. The same is true for the Port Statistic Dashboards.
How to use the dashboards
You can view the statistics dashboards via the Insights item on the top menu of the Self-Service Portal. If you are a reseller or a DE-CIX as a Service partner you see additional options concerning your customer type.
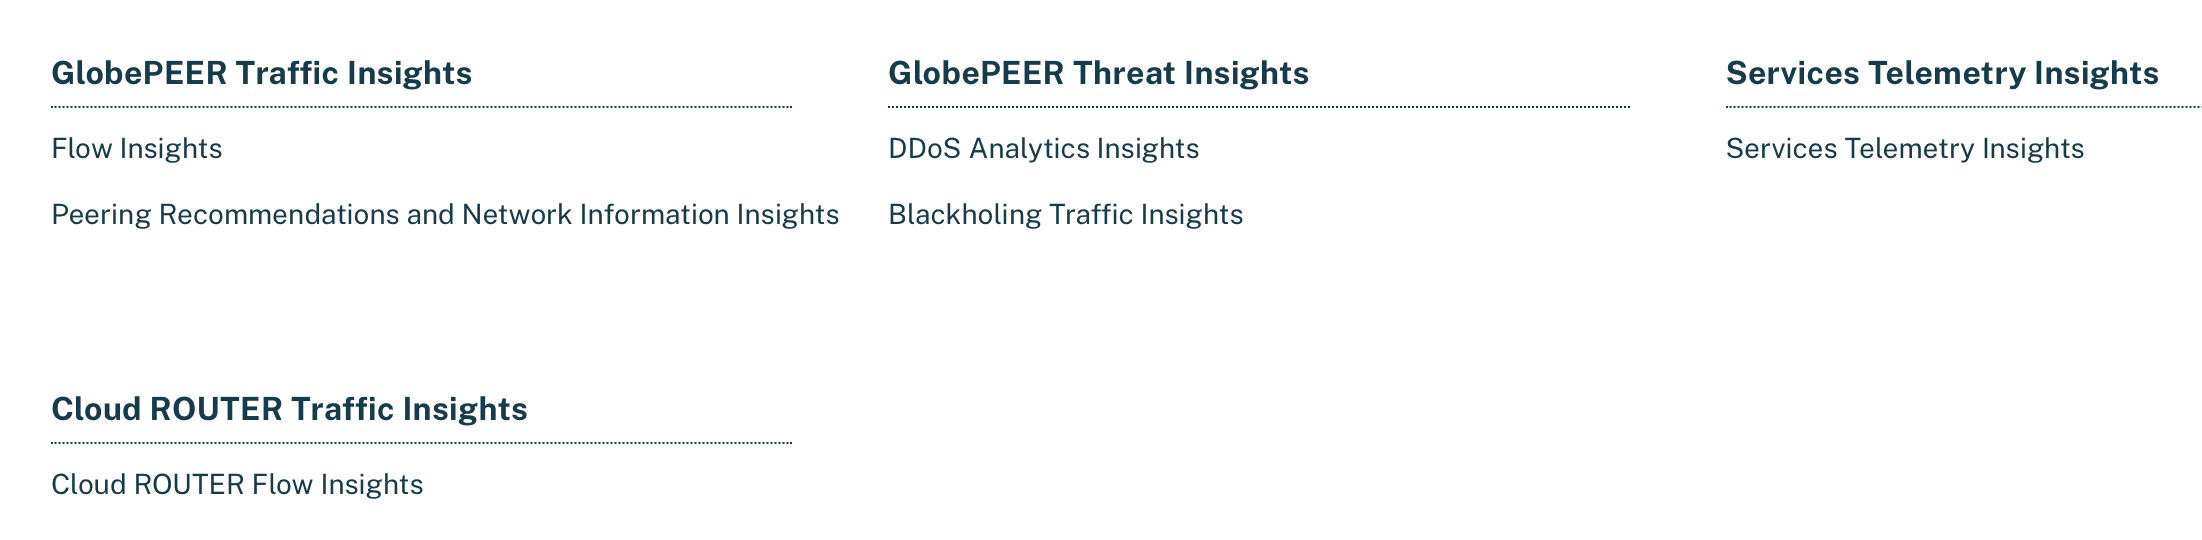
The Insights menu offers you the possibility to choose between statistics of
- GlobePEER (Peering - IPFix),
- Peering Recommendations and Network Insights,
- Cloud ROUTER Traffic Insights,
- GlobePEER Threat Insights (Peering - IPFix)
- DE-CIX Service Telemetry data.
The Flow Insights dashboards allow you to choose between several options regarding ingress and egress metrics (for example, please see below).
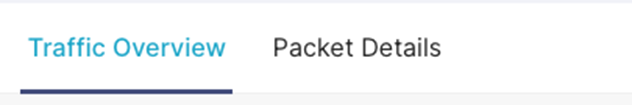
For DDoS Analytics dashboard the metrics showing ingress traffic, and you find options regarding traffic and packet details.
If you ordered a Cloud ROUTER at DE-CIX, you get the Cloud ROUTER Traffic Insights providing you ingress IPFix Flow data for your Cloud ROUTER instances.
For DE-CIX Services Telemetry Insights options exist regarding
and
On all dashboards, you find a filter section on the left side menu. To hide or show it, use the button marked below.
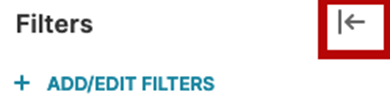
The filters in the left menu allow you to filter data as described in the "Dashboard content description"-section of this guide (see below).
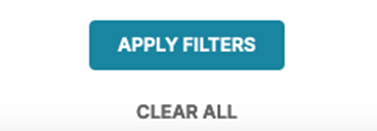
After selecting the desired values, please use the apply filters-button to activate your settings. If you want to reset all filters, you can do that with the clear all-button (shown below).
Metric Toolbar and cross-filtering options
Time-series metrics
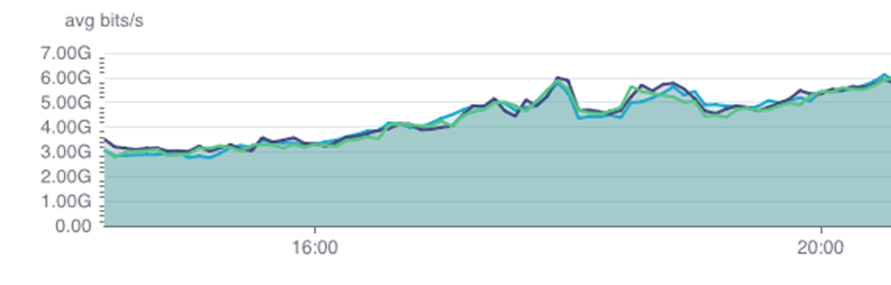
Time-series metrics have several options to choose how to display the metric data.
- A field with 3 buttons to choose the type of displaying multiple data sources in one metric (f.e. several ports in one metric).
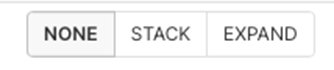
- None: Displays the metrics overlayed, not stacked.
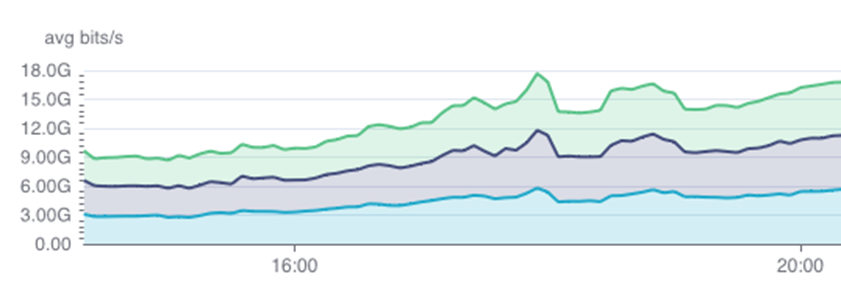
- Stack: Displays the metrics stacked.
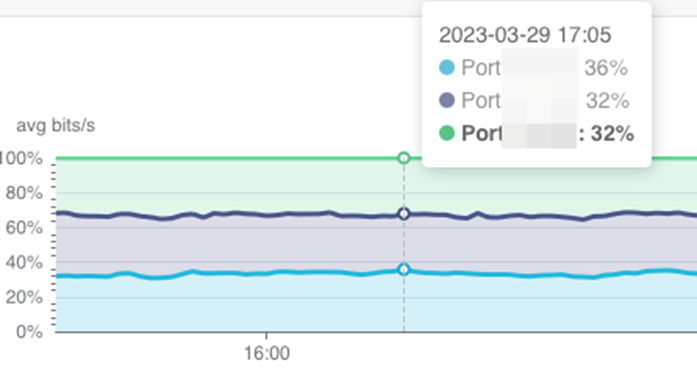
- Expand: Switches the metrics to percentage and displays the metrics of the data sources as a percentage of 100% (all data sources together).
- A time zoom area bar with related buttons
- Zoom area bar

- Zoom area bar
- Toggle the zoom area button.

After you toggle the button, you are able to zoom inside the graph as shown below:
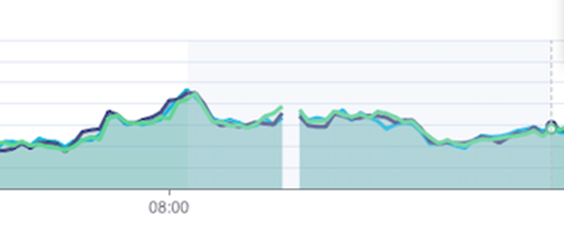
- Toggle restore zoom button restores the original zoom.

Dashboard content description
GlobePEER Insights
The GlobePEER Insights dashboards show metrics of IPFix (Flow)-data of customer routers exchanging data with DE-CIX platform.
GlobePEER Insights Filters
The GlobePEER dashboards offer several options to choose from:
- A time range
- One or multiple locations (in the case of GlobePEER Remote, where your port is visible) where data should be shown
- One or multiple customer GlobePEER service IPs
- One or multiple source/destination communication partners (ingress/egress)
- One or multiple source/destination communication service IPs (ingress/egress)
GlobePEER Insights - 5m grain (max 48h), 1h grain (max 1 month), 6h grain (max 6 month)
This dashboard shows metrics in 5 min buckets* and 1h buckets** and 6h buckets*** about the traffic processed with peering partners.
* (maximal age of data 2 days, time range adjustable)
** (maximal age of data 1 month, time range adjustable)
*** (maximal age of data 6 month, time range adjustable)
Key Metrics:
The metrics show traffic in bits per second and packets per second.
The Average bandwidth sankey metrics shows a flow diagram with the average bandwidth between the service addresses of your top 50 peering connections. You can get the average and peak values as a table in the Peak/Average bandwidth over chosen time by connection table view.
GlobePEER Advanced Insights - 6h grain (max 6 month)
This dashboard shows metrics in 6h buckets*** about your top 50 peering partners in regard of traffic exchanged.
*** (maximal age of data 6 month, time range adjustable)
Key Metrics:
Source/Destination Service IPs
(Peering IPs) (the IPs of the customer routers connected to the DE-CIX Platform and your peering partners)).
Origin Source/Destination IPs of traffic (anonymized with the last octet for IPv4 and the last two segments for IPv6).
Autonomous System Number (ASN).
Peering Recommendations and Network Insights
This dashboard provides personalized peering recommendations based on your current services and connections on the DE-CIX platform. It also offers insights into the status of your route server sessions and your ASN information (sourced from external databases such as RIPE DB and PeeringDB).
Peering Recommendations and Network Insights filters
- A time range
- One or multiple locations (in the case of GlobePEER Remote, where your port is visible) where data should be shown
- ASN (if you have more than one ASN)
Key Metrics:
Peering Recommendations
Identify opportunities to expand your peering. These recommendations highlight cases where you already peer with a customer at one location, but could also establish peering with them at additional DE-CIX exchange points where you are connected.
Missing Peering Partners per Location
View a list of potential peering partners that are available in your locations but with whom you are not yet peering.
No Incoming/Outgoing Traffic
Detect potential asymmetrical peering scenarios by identifying sessions that show no incoming or outgoing traffic.
Route Server Status
This section provides a daily-updated overview of the status of your Route Server sessions (data sourced from lg.de-cix.net). It also includes access to historical session data for trend analysis and troubleshooting.
ASN Overview and External Insights
Prefixes / ASN Rank, Peers / Upstreams / Downstreams, Joins and Leaves, Maps / GeoData
Get detailed information about your ASN from external sources such as RIPE DB and PeeringDB. This includes routing metrics, relationship details, and geographic visualization of your network presence.
GlobePEER Threat Insights
DDoS Analytics Insights
The DDoS Analytics Insights dashboards show metrics of possible DDoS Traffic in customers peering traffic based on IPFix (Flow)-data on the DE-CIX platform.
DDoS Analytics Insights filters
The GlobePEER DDoS Traffic Insights dashboards offer several options to choose from:
- A time range
- DDoS confidence - Select your preferred DDoS detection confidence level, ranging from 70% to 90%, allowing you to balance between sensitivity and accuracy in threat recognition.
- One or multiple locations (in the case of GlobePEER Remote, where your port is visible) where data should be shown
- One or multiple customer GlobePEER service IPs
- One or multiple source/destination communication partners (ingress/egress)
- One or multiple source/destination communication service IPs (ingress/egress)
Key Metrics:
- DDoS share of traffic
- DDoS share of packets
- DDoS bandwidth top 50
- DDoS Packets by source/destination protocol, packet size, destination address distribution, DDoS rule distribution and relating DDoS rules
Blackholing Traffic Insights
The Blackholing Insights show metrics of your blackholed traffic (Blackholing v1.0) .
Blackholing Insights filter
- A time range
- One or multiple locations (in the case of GlobePEER Remote, where your port is visible) where data should be shown
- One or multiple customer GlobePEER service IPs
- One or multiple source/destination communication partners (ingress/egress)
- One or multiple source/destination communication service IPs (ingress/egress)
Key Metrics:
- Number of blackholed rules and which rules are matching
- Traffic and packets per rule
- Blackholed connections traffic volume Top 50
- Geographic distribution per packet source
- IP/port distribution pie charts
Cloud ROUTER Flow Insights
The Cloud ROUTER Flow Insights dashboards show metrics of IPFix (Flow)-data of customer Cloud ROUTERs exchanging data through DE-CIX platform.
Cloud ROUTER Flow Insights Filters
The GlobePEER dashboards offer several options to choose from:
- A time range
- A customer filter (in case you are reseller, in case you are no reseller it is you)
- One or multiple locations where your Cloud ROUTER is located
- Your Cloud ROUTER instances
This dashboard shows metrics in 5 min buckets (max age 6 month).
The traffic and packet rate metrics show traffic in bits per second and packets per second.
The Average bandwidth sankey metrics shows a flow diagram with the average bandwidth between the ASNs of your top 50 Cloud ROUTER connections. You can get the average and peak values as a table in the Average/Peak Bandwidths between ASes - Table view.
The piecharts at the bottom shows the source and destination IP percentage at the overall traffic.
DE-CIX Services Telemetry Insights
The dashboard shows metrics of customer ports (single or aggregated in LAGs) connected to the DE-CIX platform (maximal age of data 5 years).
Access Insights Filters
The Telemetry Insights dashboard offers several options to choose from:
- A time range (max. 100.000 datapoints)
- One or multiple locations (in the case of the GlobePEER Remote service, the location where your port is physically connected)
- The datacenter where the service is located
- One or multiple customer ports
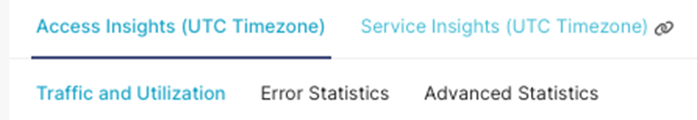
Ports - Traffic Statistics
This dashboard shows the average bits/s, average packets/s of a 5-minute bucket of data and the utilization of the chosen Access Port.
Port - Errors Statistics
This dashboard shows error counts for your port(s):
- Errors (Number of packet errors - sth. is wrong with the packet (TX/RX or format error)
- Discards (Number of packet discards - misconfiguration of port, lack of bandwidth or hardware)
Port - Advanced Statistics
This dashboard shows the below listed advanced statistics for your port(s):
- Drop events (number of all packet drop events)
- Jabbers (number of packets that couldn't be assigned to an ethernet protocol type)
- Symbol errors (number of packets where the optical signal is wrong or too weak and couldn't be decoded properly)
- FCS/CRC errors (number of packets where packet checksum is wrong, possibly a result of symbol errors)
- Oversized packets (incoming packets bigger than configured maximal MTU)
- Undersized packets (incoming packets smaller than the minimum MTU of 512 bits)
Ports - Operational State Changes
The operational overview dashboard shows the operational state changes (up/down) of the chosen port(s).
Service Insights
Shows dashboard metrics for your services on the DE-CIX platform.
GlobePEER, DirectCLOUD, VirtualPNI Service Statistics Filters
The Telemetry Service dashboards offer several possibilities to choose from:
- a time range (max. 50.000 datapoints = timespan ~170 days)
- one or multiple customer Network Access Service(s) (ports)
- one or multiple locations (in the case of the GlobePEER Remote service, the location where your port is physically connected) where data should be shown
- the datacenter where the service is located
- one or multiple sub-customers in case you are a reseller of DE-CIX services (all other customers only have their own customer-/company name as an option)
- one or multiple selection of your service(s), for example, Peering Access Services (PAS) or VLAN Services (VLS).
Service Traffic Statistics
This dashboard shows the average bits/s of a 5-minute bucket of data of the chosen service.
Cloud ROUTER Traffic Statistics
The Cloud ROUTER Service dashboards offer several possibilities to choose from:
- A time range (max. 50.000 datapoints = timespan ~170 days)
- A metro area (The IXP where the Cloud ROUTER and its services are deployed)
- One or multiple Cloud ROUTER(s)
- One or multiple Cloud Service Provider and/or NAS IDs (Network Access Service)
- one or multiple Cloud Service Provider in case of DirectCLOUD service, to which your Cloud ROUTER service is connected.
- one or multiple of customers VirtualPNI-NAS IDs in case of VirtualPNI service
- One or multiple Cloud onRamps and/or datacenters
- one or multiple Cloud onRamps in case of DirectCLOUD service, to which your Cloud ROUTER service is connected.
- one or multiple datacenter(s) in which your VirtualPNI service is connected
- One or multiple selection of your service(s), for example VirtualPNI or DirectCLOUD
This dashboard shows
- the average bits/s of a 5-minute bucket of data of the chosen service.
- the average packets/s of a 5-minute bucket of data of the chosen service.
- a point-to-point Sankey diagram to see which of your services transports the most traffic to its bgp neighbor address.
Need help? Get in touch with our customer service.