Release Notes
Getting started
DE-CIX Access
Overview and technical specifications
Create a new Access or LAG
Monitor your Access
Delete your Access
GlobePEER
Overview GlobePEER
Create your GlobePEER service
Manage your GlobePEER service
Delete your GlobePEER service
Blackholing Services
Route Service
Route Server Guides
DE-CIX ASEAN GlobePEER Route Server Guide
DE-CIX Barcelona GlobePEER Route Server Guide
DE-CIX Chicago GlobePEER Route Server Guide
DE-CIX Copenhagen GlobePEER Route Server Guide
DE-CIX Dallas GlobePEER Route Server Guide
DE-CIX Dusseldorf GlobePEER Route Server Guide
DE-CIX Esbjerg GlobePEER Route Server Guide
DE-CIX Frankfurt GlobePEER Route Server Guide
DE-CIX Hamburg GlobePEER Route Server Guide
DE-CIX Helsinki GlobePEER Route Server Guide
DE-CIX Houston GlobePEER Route Server Guide
DE-CIX Istanbul GlobePEER Route Server Guide
DE-CIX Jakarta GlobePEER Route Server Guide
DE-CIX Kristiansand GlobePEER Route Server Guide
DE-CIX Kuala Lumpur GlobePEER Route Server Guide
DE-CIX Leipzig GlobePEER Route Server Guide
DE-CIX Lisbon GlobePEER Route Server Guide
DE-CIX Madrid GlobePEER Route Server Guide
DE-CIX Malaysia GlobePEER Route Server Guide
DE-CIX Marseille GlobePEER Route Server Guide
DE-CIX Mexico GlobePEER Route Server Guide
DE-CIX Munich GlobePEER Route Server Guide
DE-CIX New York GlobePEER Route Server Guide
DE-CIX Oslo GlobePEER Route Server Guide
DE-CIX Palermo GlobePEER Route Server Guide
DE-CIX Phoenix GlobePEER Route Server Guide
DE-CIX Richmond GlobePEER Route Server Guide
DE-CIX Rio De Janeiro GlobePEER Route Server Guide
DE-CIX Sao Paulo GlobePEER Route Server Guide
ACIX GlobePEER Route Server Guide
AF-CIX GlobePEER Route Server Guide
AqabaIX GlobePEER Route Server Guide
Borneo-IX GlobePEER Route Server Guide
Doha IX Route Server Guide
IRAQ-IXP Route Server Guide
Penang IX Route Server Guide
PIE Karachi GlobePEER Route Server Guide
Ruhr-CIX GlobePEER Route Server Guide
SEECIX GlobePEER Route Server Guide
UAE-IX GlobePEER Route Server Guide
Action BGP Communities (Route Server Control)
DE-CIX GlobePEER Route Server Action BGP Communities
ACIX GlobePEER Route Server Action BGP Communities
AF-CIX GlobePEER Route Server Action BGP Communities
AqabaIX GlobePEER Route Server Action BGP Communities
Borneo-IX GlobePEER Route Server Action BGP Communities
IRAQ-IXP Route Server Action BGP Communities
PIE Karachi GlobePEER Route Server Action BGP Communities
Ruhr-CIX GlobePEER Route Server Action BGP Communities
SEECIX GlobePEER Route Server Action BGP Communities
UAE-IX GlobePEER Route Server Action BGP Communities
Doha IX Route Server Action BGP Communities
Informational BGP Communities (Route Details)
DE-CIX GlobePEER Route Server Informational BGP Communities
ACIX GlobePEER Route Server Informational BGP Communities
AF-CIX GlobePEER Route Server Informational BGP Communities
AqabaIX GlobePEEER Route Server Informational BGP Communities
Borneo-IX GlobePEER Route Server Informational BGP Communities
IRAQ-IXP Route Server Informational BGP Communities
PIE Karachi GlobePEER Route Server Informational BGP Communities
Ruhr-CIX GlobePEER Route Server Informational BGP Communities
SEECIX GlobePEER Route Server Informational BGP Communities
UAE-IX GlobePEER Route Server Informational BGP Communities
Doha IX Route Server Informational BGP Communities
Looking Glass Guides
DE-CIX GlobePEER Looking Glass Guide
ACIX GlobePEER Looking Glass Guide
AF-CIX GlobePEER Looking Glass Guide
AqabaIX GlobePEER Looking Glass Guide
Borneo-IX GlobePEER Looking Glass Guide
IRAQ-IXP Looking Glass Guide
PIE Karachi Looking Glass Guide
Ruhr-CIX GlobePEER Looking Glass Guide
SEECIX GlobePEER Looking Glass Guide
UAE-IX GlobePEER Looking Glass Guide
Doha IX Looking Glass Guide
Notes on additional Routes (incl. Google VPP) via GlobePEER Route Service
Closed User Groups
DirectCLOUD
Overview and Monitoring
Cloud Connections
DirectCLOUD for Microsoft Azure
Create DirectCLOUD Connection for Azure
How to order a DirectCLOUD connection for Azure
Create or upgrade Gateways for your Azure ExpressRoute
Manage your Azure Cloud Connection
Upgrade / downgrade a DirectCLOUD service for Azure
Change DirectCLOUD configurations for Azure
Delete DirectCLOUD configurations for Azure
Monitoring Azure ExpressRoute uptime
Monitor your connection
Updating the Cloud Key for Your Azure DirectCLOUD Service
Delete your Azure Cloud connection
FAQ DirectCLOUD for Microsoft Azure
DirectCLOUD for AWS
Create DirectCLOUD connection for AWS
Manage your DirectCLOUD connection for AWS
Upgrade / downgrade the connection
Change DirectCLOUD configurations for AWS
Delete DirectCLOUD configurations for AWS
Monitoring AWS DirectConnect uptime
Monitor your connection
Delete your AWS Cloud connection
DirectCLOUD for IBM
Create DirectCLOUD connection for IBM
Manage your DirectCLOUD connection for IBM
Upgrade / downgrade a DirectCLOUD service for IBM
Change DirectCLOUD configurations for IBM
Delete DirectCLOUD configurations for IBM
Monitor your connection
Delete your IBM Cloud connection
DirectCLOUD for GCloud
Cloud ROUTER
Overview & use cases
Create / Manage your Cloud ROUTER
Create / Manage the configurations
Add a configuration
Upgrade / downgrade a configuration
Change your Cloud ROUTER configurations
Monitor your configurations
Delete a Cloud ROUTER configuration
Advanced Settings Cloud ROUTER
VirtualPNI
Overview VirtualPNI
Create your VirtualPNI
Order and configure your VirtualPNI between two Accesses
Order and configure your VirtualPNI between Access and Cloud ROUTER
Manage your VirtualPNI
Upgrade / Downgrade your VirtualPNI service
Change VirtualPNI configurations
Delete VirtualPNI configurations
Monitor your VirtualPNI
Delete your VirtualPNI service
Colocation
Out-of-band access to your DE-CIX colocated equipment
Shipping Information
Colocation equipment management for Digital Realty data centers
DE-CIX API
Overview DE-CIX API
Quick API Reference
Cloud ROUTER Postman Collection
Monitor and Visibility of Learned Routes and Advertised Routes by API
BGP Ingress and Egress Filters Usage by API
Terraform Provider
Terraform Provider Overview
Getting Started
Provider Configuration
Managing Services
State Management
End-to-End Example
Service Insights System
Service Insights System - Tutorial
Standard customer Service Insights Tutorial (for customers without reselling services or DaaS location)
Service Telemetry Insights Tutorial
GlobePEER Traffic Insights Tutorial
GlobePEER Threat Insights Tutorial
Cloud ROUTER Traffic Insights Tutorial
Reseller Service Insights Tutorial
Reseller GlobePEER Traffic Insights Tutorial
Reseller GlobePEER Threat Insights Tutorial
Reseller Service Telemetry Insights Tutorial
Partner (DaaS) Service Insights Tutorial
Partner GlobePEER Traffic Insights Tutorial
Partner Service Telemetry Insights Tutorial
Partner GlobePEER Threat Insights Tutorial
Service Insights Tutorial - General Informations
Service Insights System
Account administration
Add new users or subcustomers
Manage user roles and permissions
Multi-Factor-Authentification
Retrieving username and reset password
Delete a user
Customer service and ticket system
Table of Contents
Service Telemetry Insights Tutorial

This article shows how to use the Service Insights system to monitor traffic, detect issues, and answer key network questions for our Standard customers, defined as those who neither resell services nor operate a DE-CIX as a service (DaaS) location.
General hints about the usage of Service Insights can be found at: Service Insights Tutorial - General Informations
How much traffic do all my accesses (or some of my accesses) have?
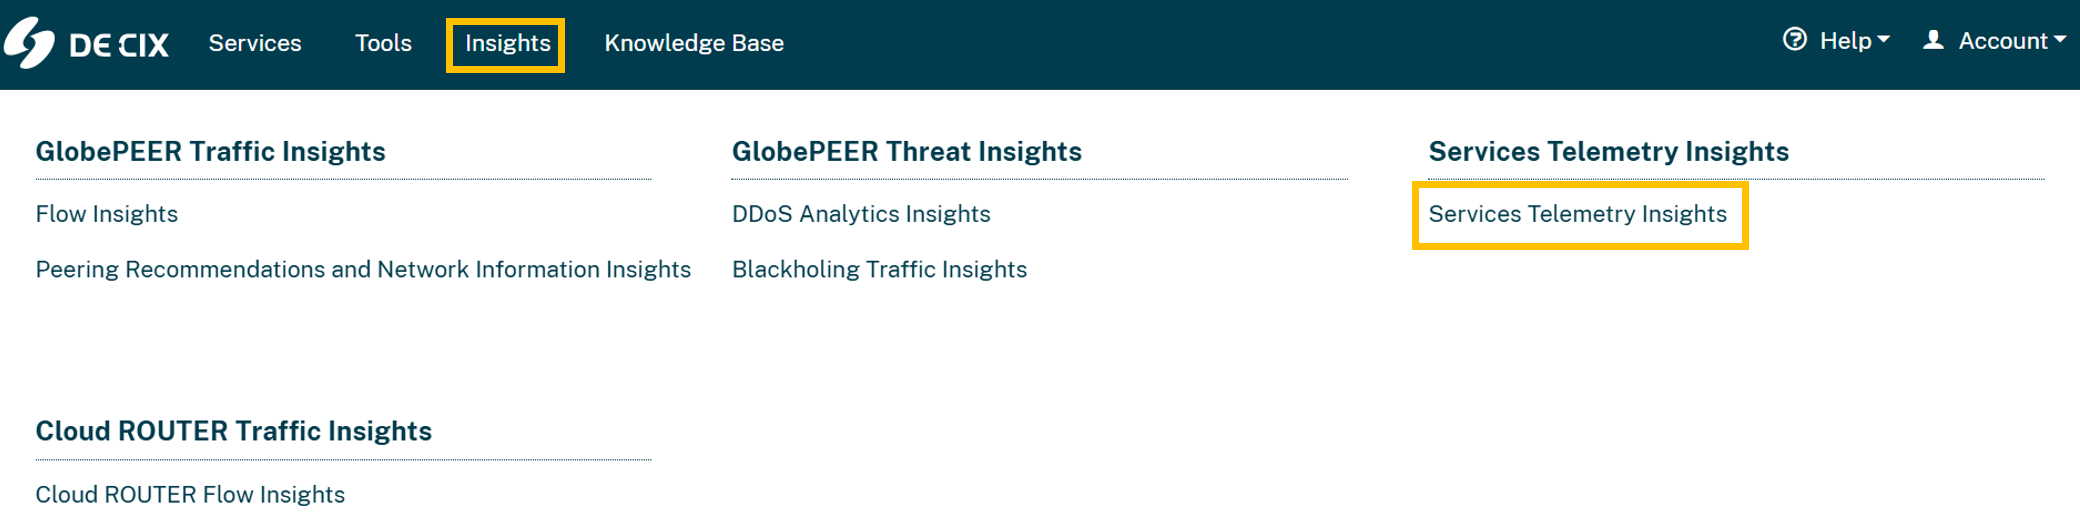
Enter the Insights menu and select Service Telemetry Insights.

This navigates you to the dashboard, which allows you to get telemetry data of your ordered (and operative) Access and Services.
You'll see traffic data for all your accesses under the Access Insights (UTC Timezone) tab.
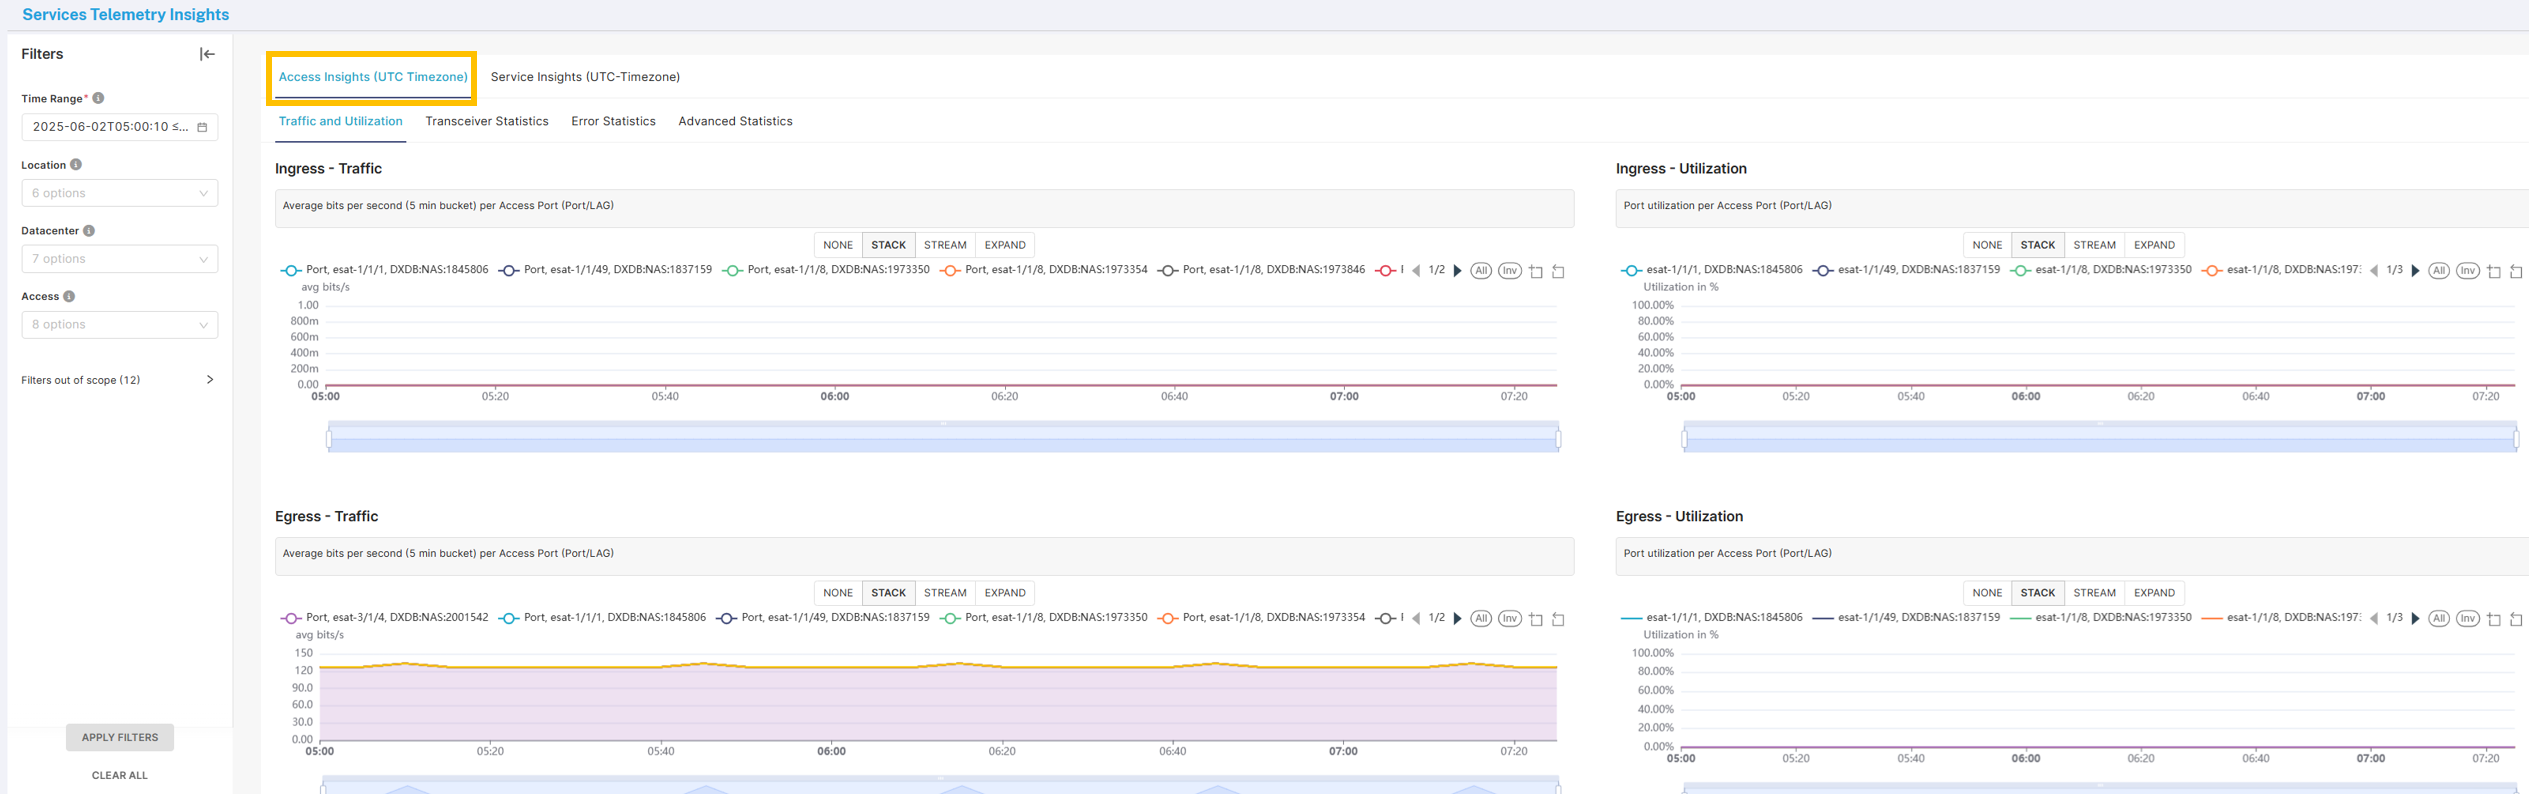
If there is no filter selected, the traffic of all accesses is shown.
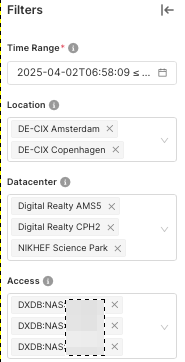
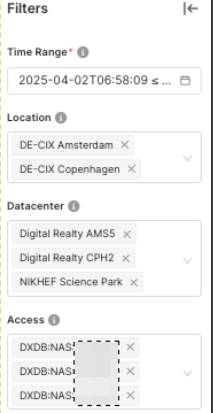
If you want to see just a subset of your accesses or a specific location, adjust the filters on the left side of the dashboard.
Use the filters on the left to narrow the view by time range, location, datacenter or specific accesses.
How much traffic do all my services have?
Go to the Insights menu and select Service Telemetry Insights.
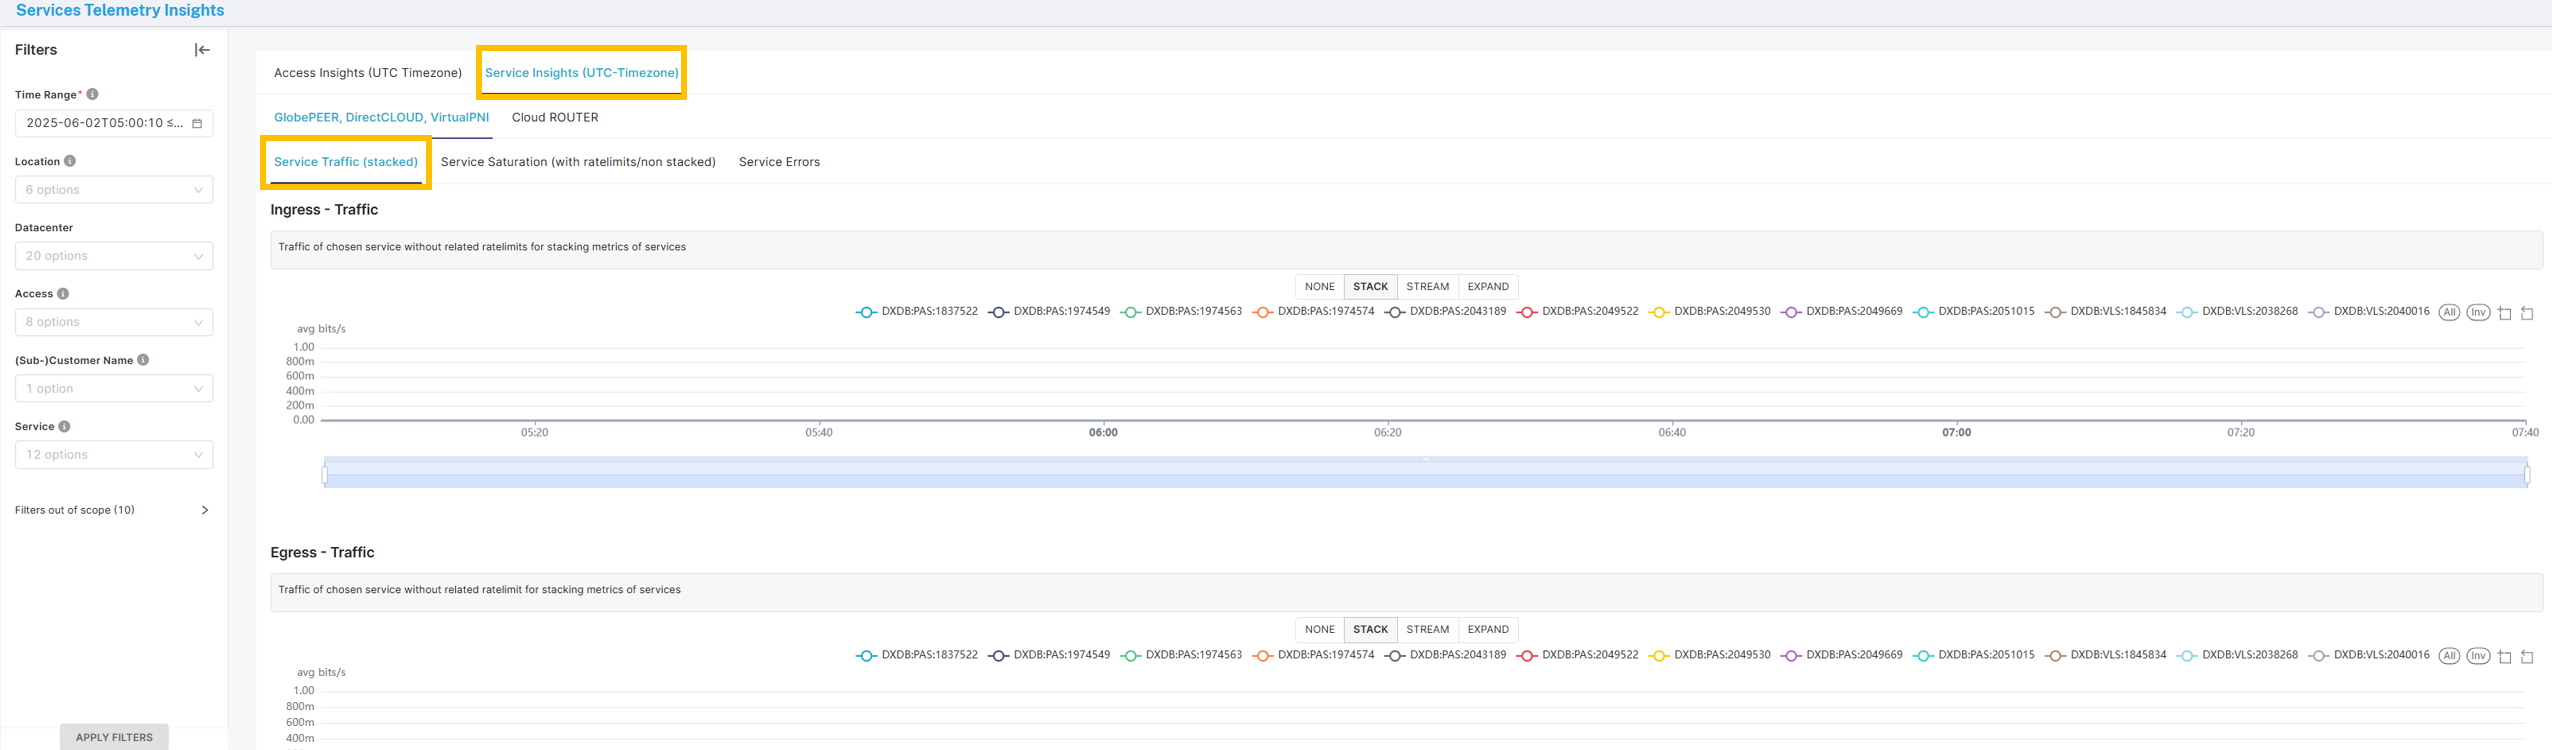
In Service Telemetry Insights, open the Service Insights (UTC Timezone) tab.
This navigates you to the dashboard which offers you the opportunity to get telemetry data of your ordered (and operative) Access and Services
At the second tab Service Insights (UTC Timezone) you will find a first tab Service Traffic (stacked) which shows combined traffic for your services (stacked).
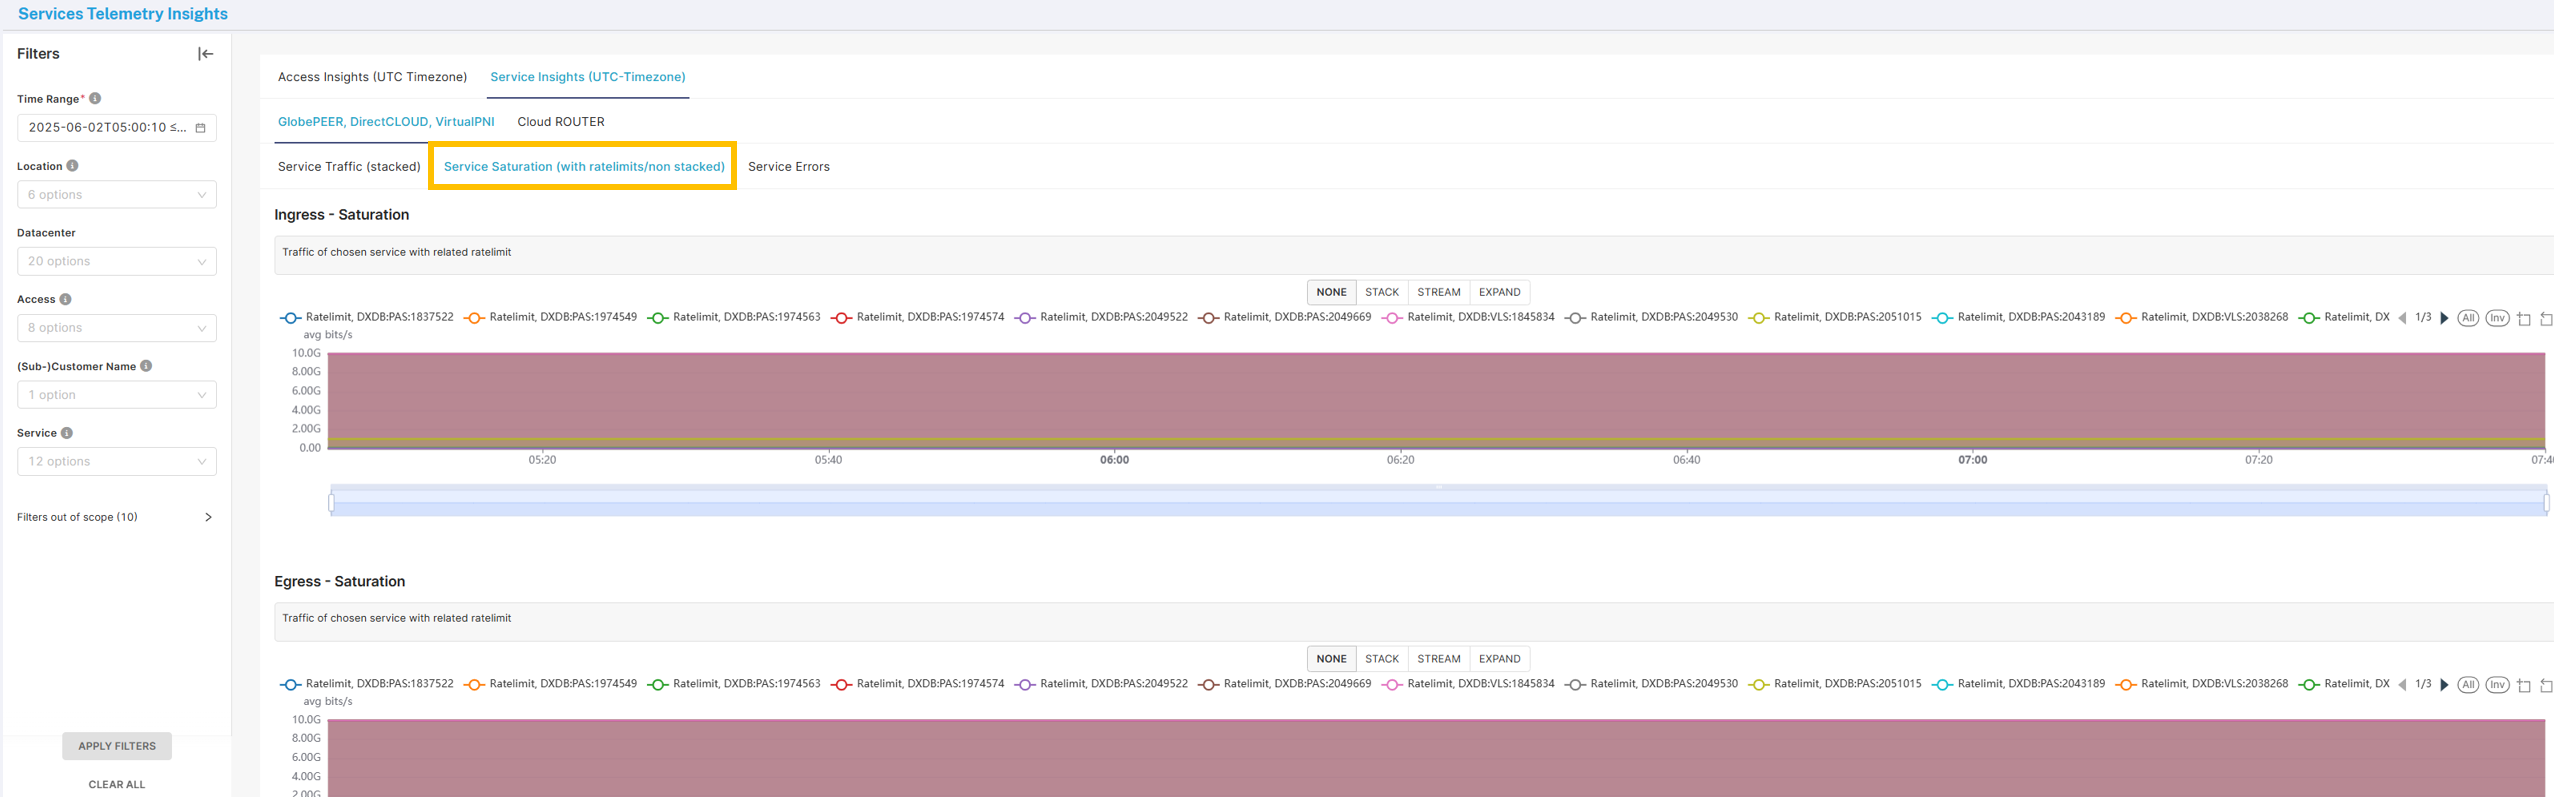
If you switch to the tab "Service Traffic (with ratelimits/non stacked) you can also see the ratelimits of your service and how much of the traffic is utilizing the maximum rate limit of the service
How much traffic do one (or a subset) of my services have?
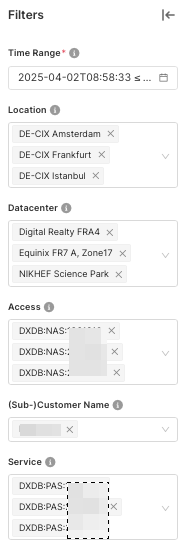
If you want to see just a subset of your service or a specific location than feel free to adjust the filters on the left side of the dashboard.
You can change the time range and choose one or more filter options of the different filter possibilities to just see a subset of your services.
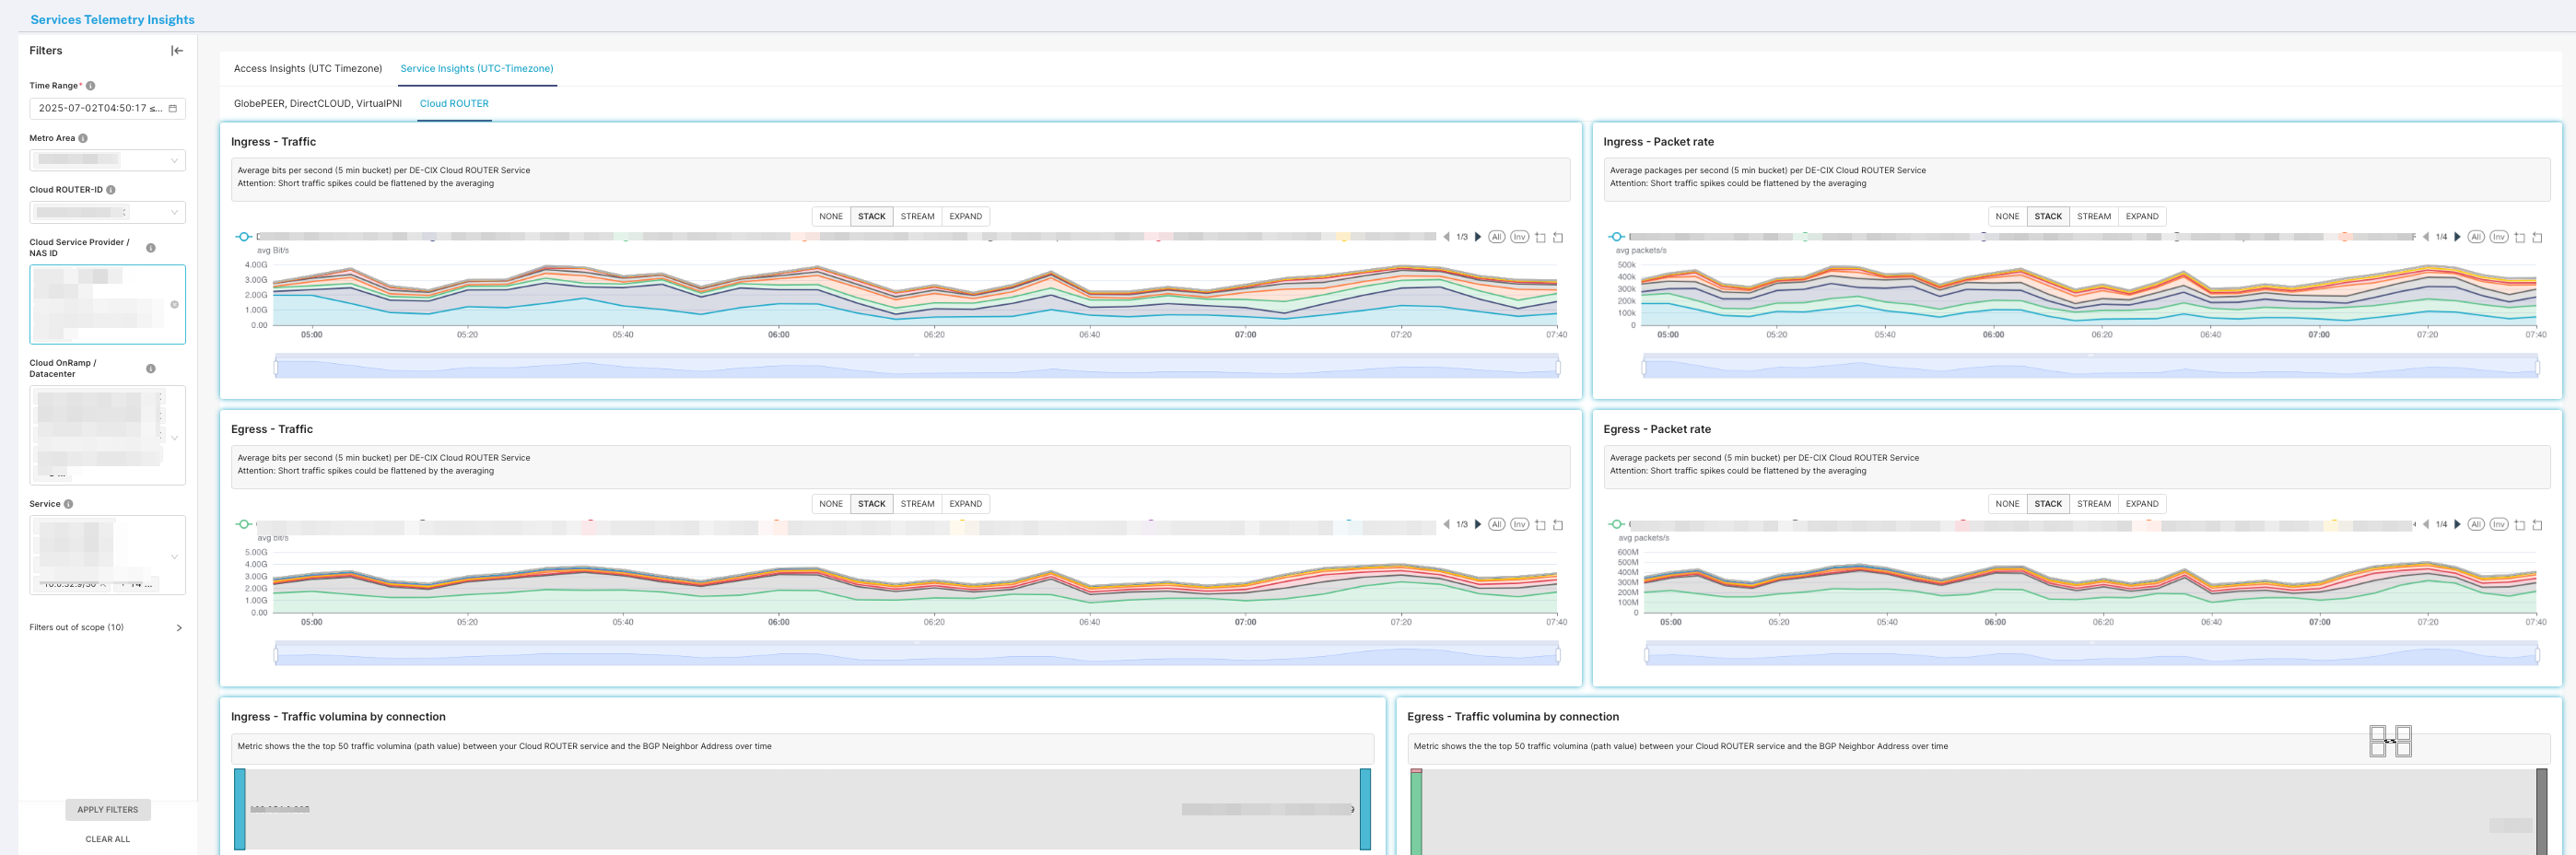
Cloud ROUTER telemetry service dashboards
If you are a Cloud ROUTER customer, you have access to the Cloud ROUTER service dashboard. This dashboard give you the ability to see the telemetry data (bandwidth, packet rates and traffic volumina) of your Cloud ROUTERs.
You can choose serveral filters like time range, Metro Area (location), Cloud ROUTER id, Cloud service provider/NAS ID, Cloud OnRamp (datacenter), Service (Cloud ROUTER)
Do I have errors on my accesses or services(s)?
Insights offers you the ability to encounter if you have errors on your accesses and services.
For evaluating errors navigate to the Service Telemetry Insights.

Accesses
Enter the tab Access Insights (UTC Timezone) and the second tab Error Statistics (Advanced statistics tab provides you informations like CRC-Errors, oversized/undersized packets, jabbers, drop events and symbol errors).
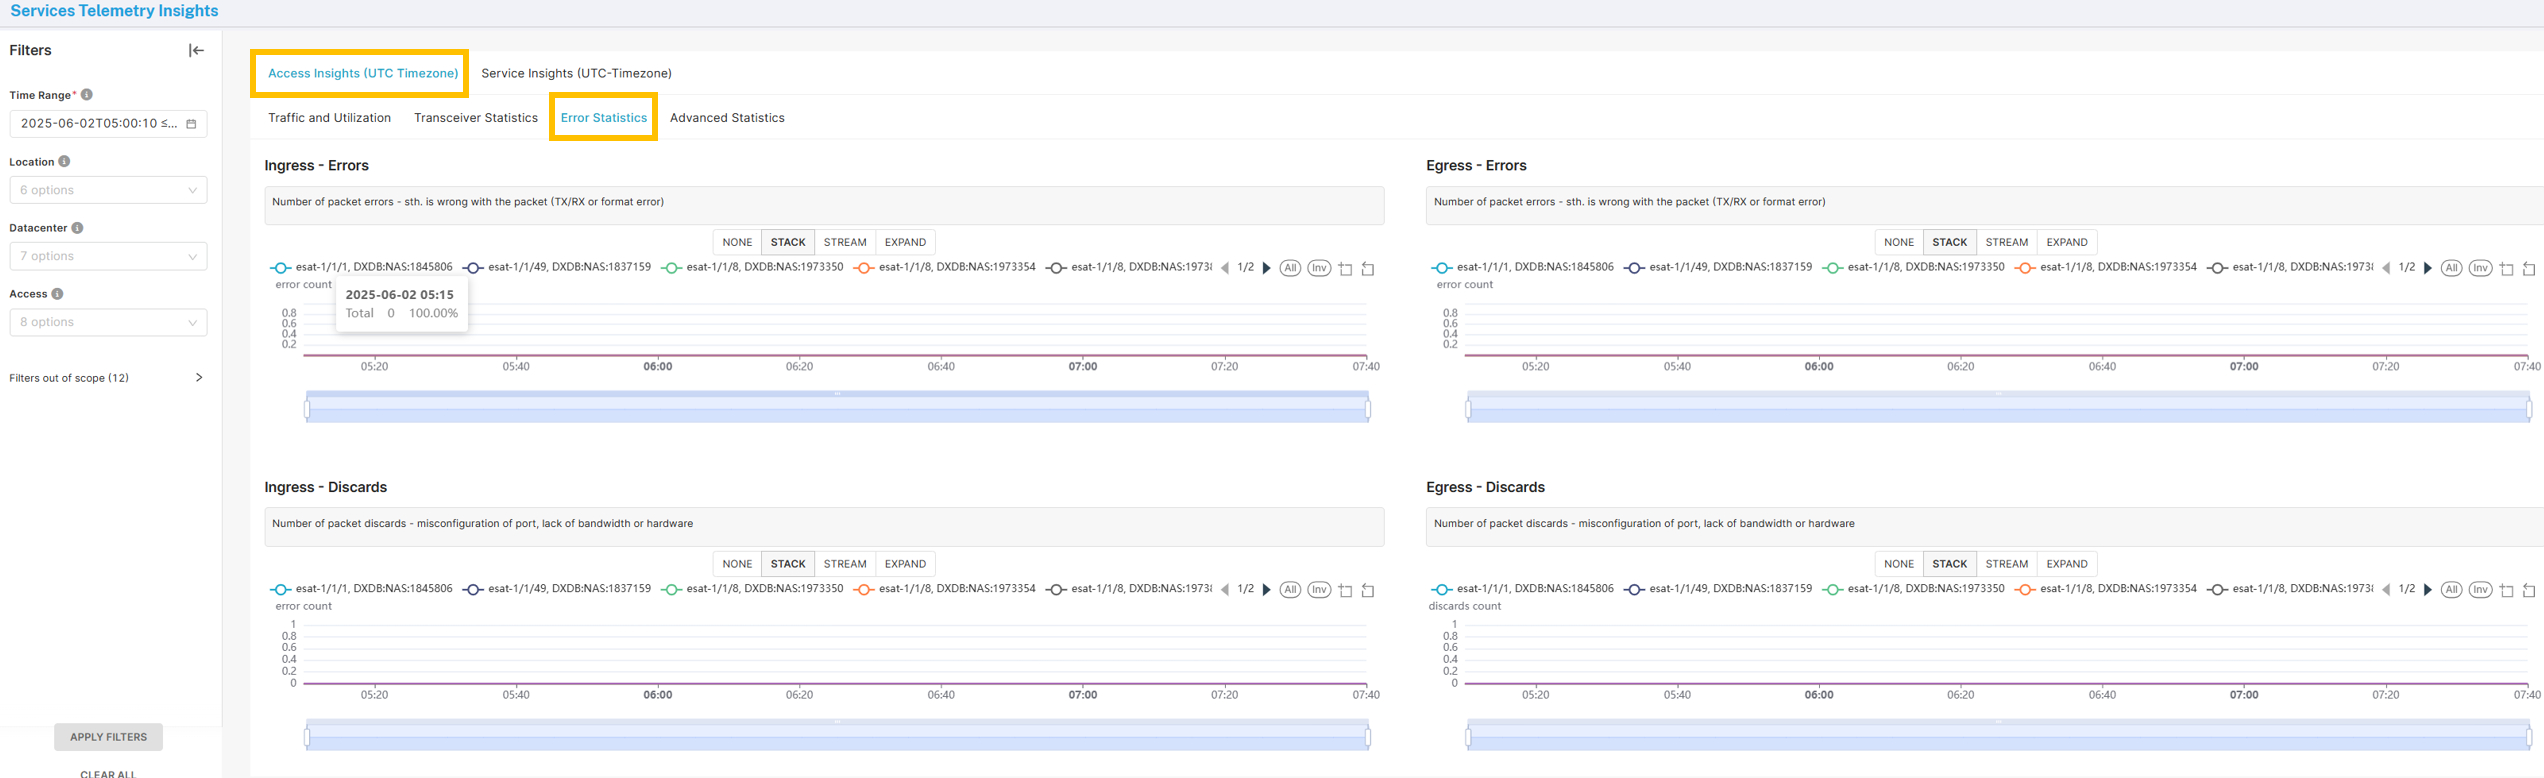
If you want to see just a subset of your accesses or a specific location than feel free to adjust the filters on the left side of the dashboard.
You can change the time range and choose one or more filter options of the different filter possibilities to just see a subset of your accesses.
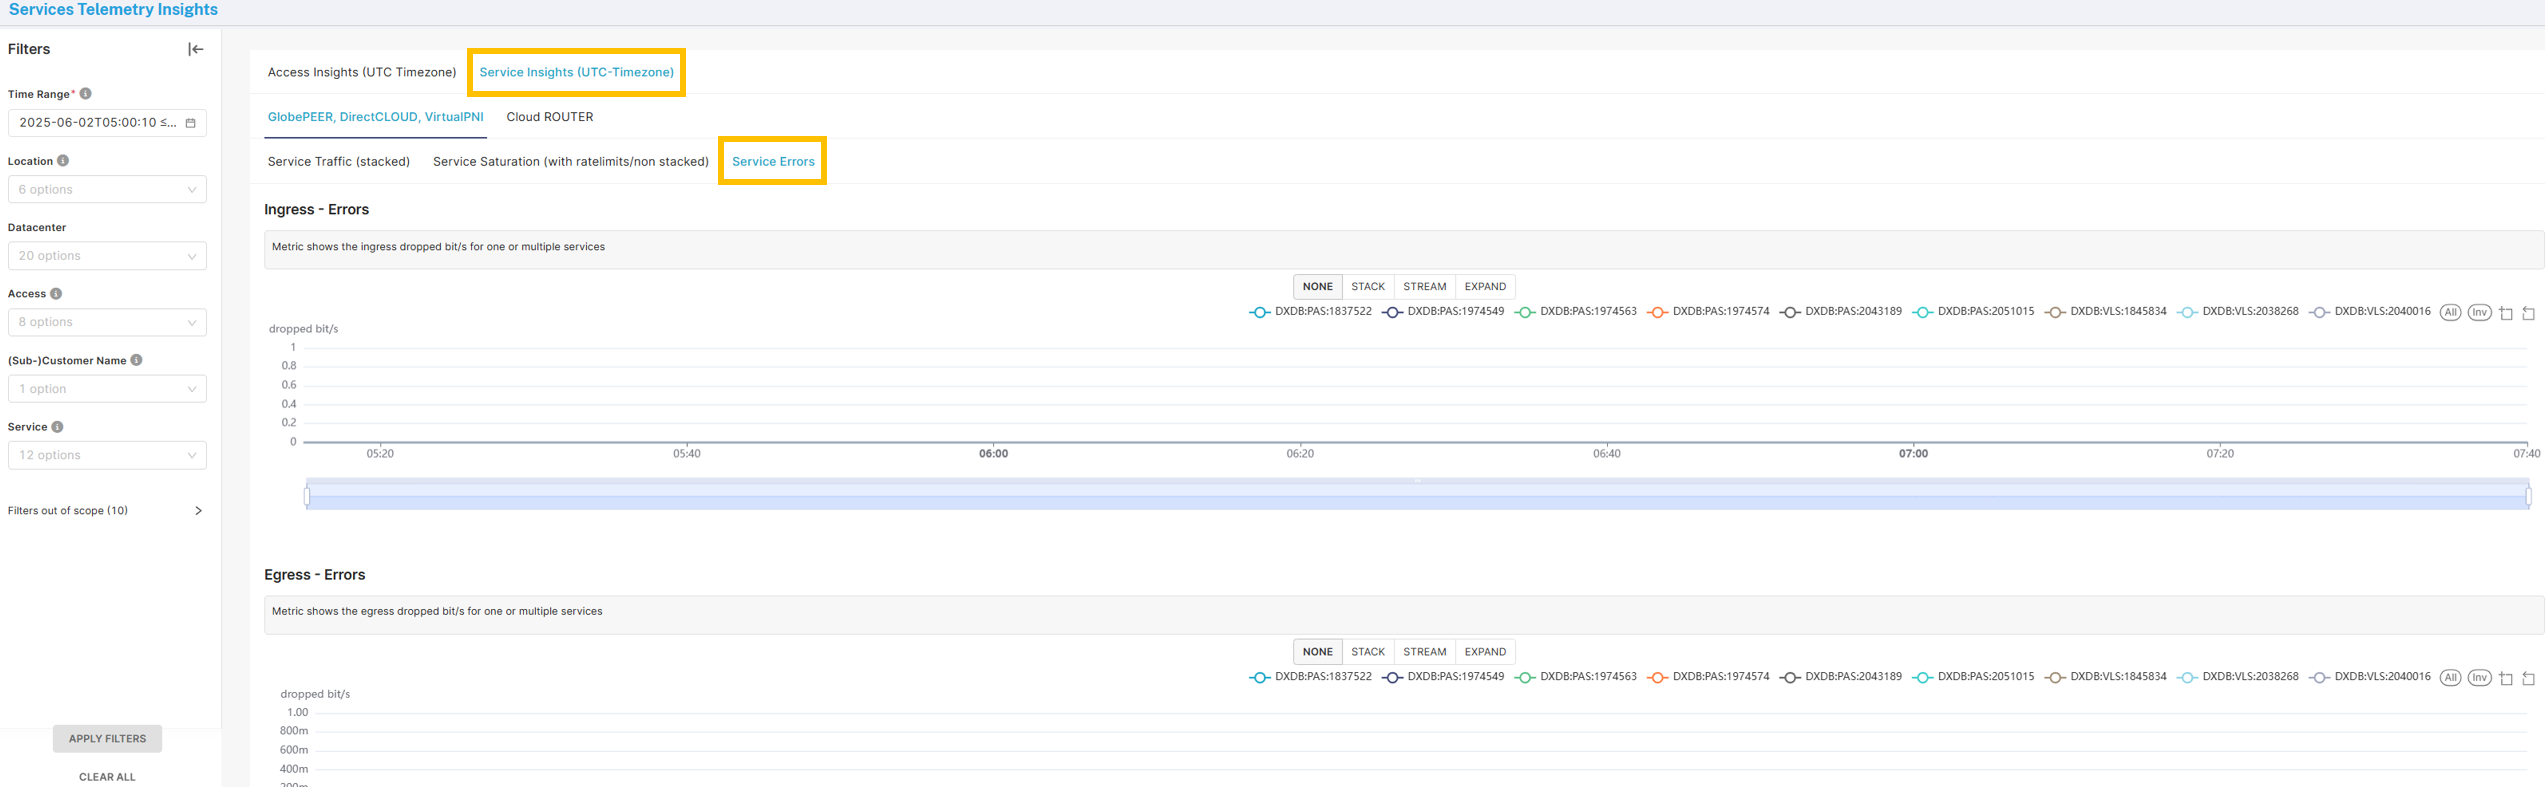
Services
Enter the tab Service Insights (UTC Timezone) and the second tab Service Errors to see ingress and egress service errors (drops)
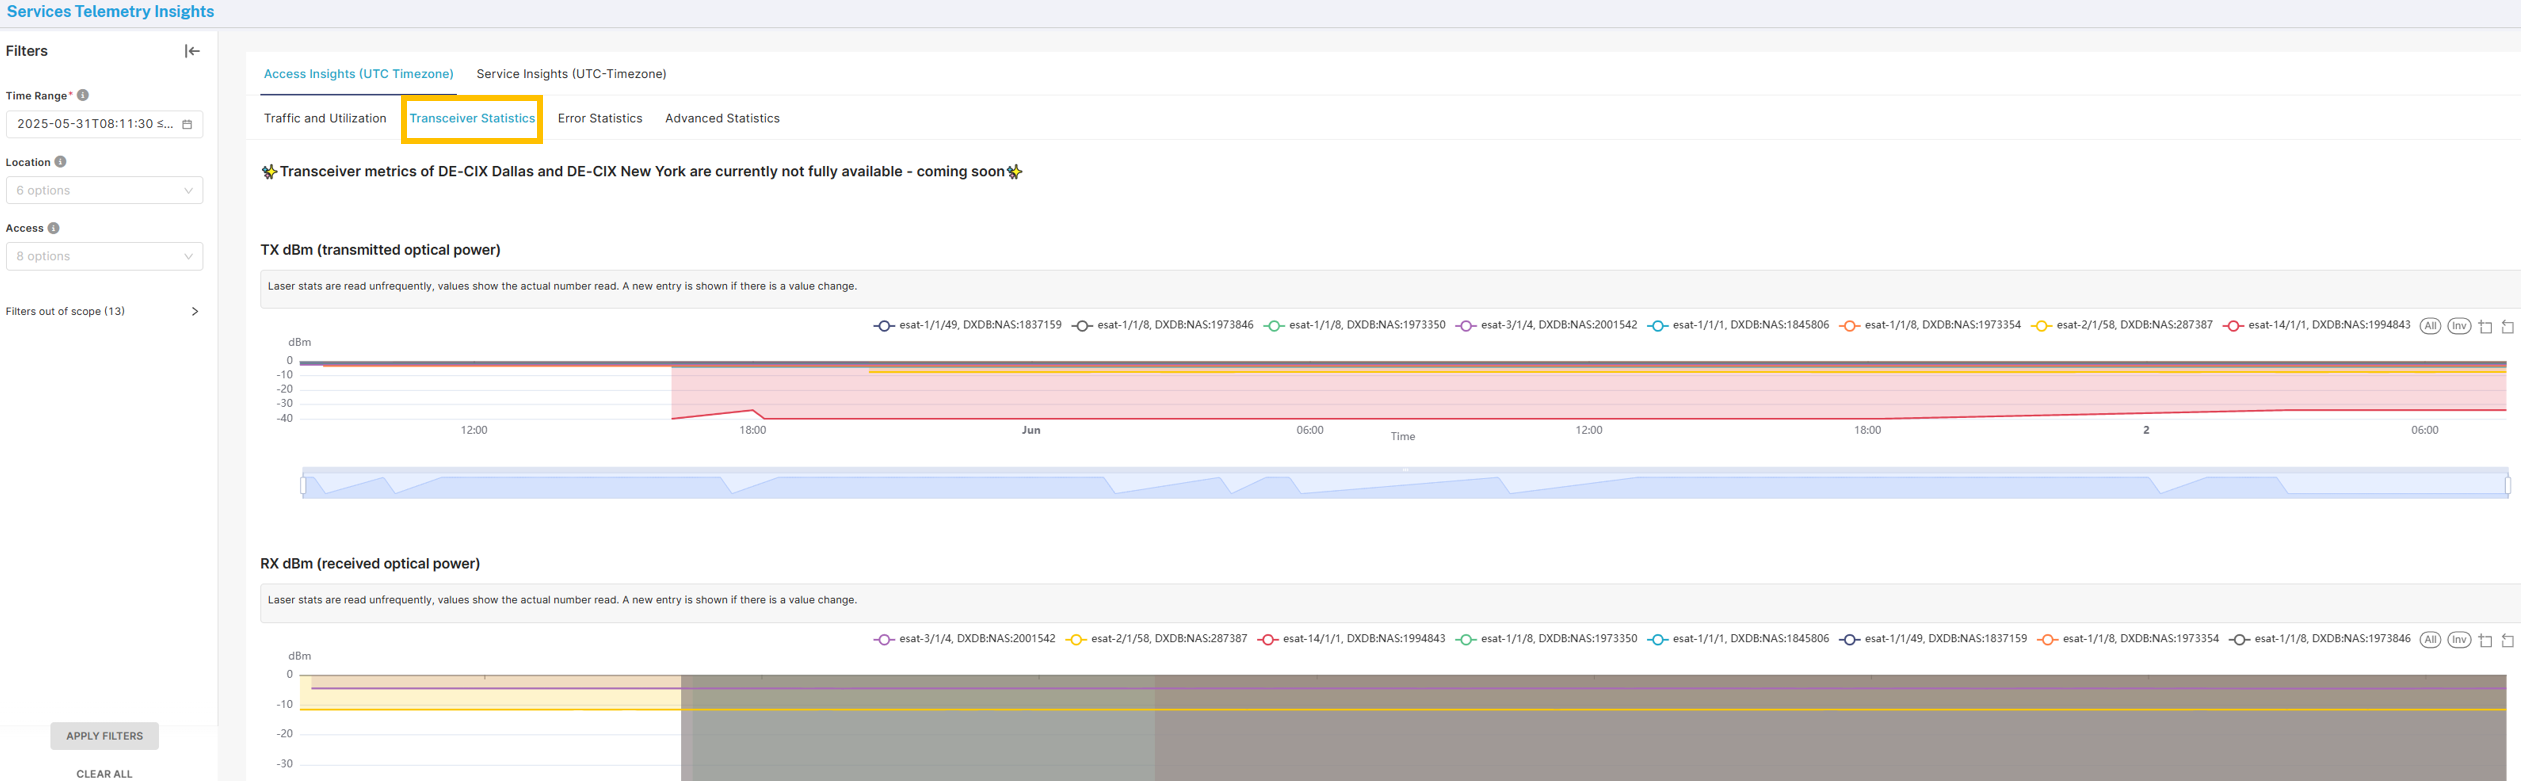
How do my light levels on my transceiver of my Access is looking?
For evaluating light levels navigate to the Service Telemetry Insights and enter the section Transceiver Statistics.
You can choose the filters in filter section for more specific details like choosing a location or a specific Access.